Tag Archives: performance

Mid-stack inlining in Go

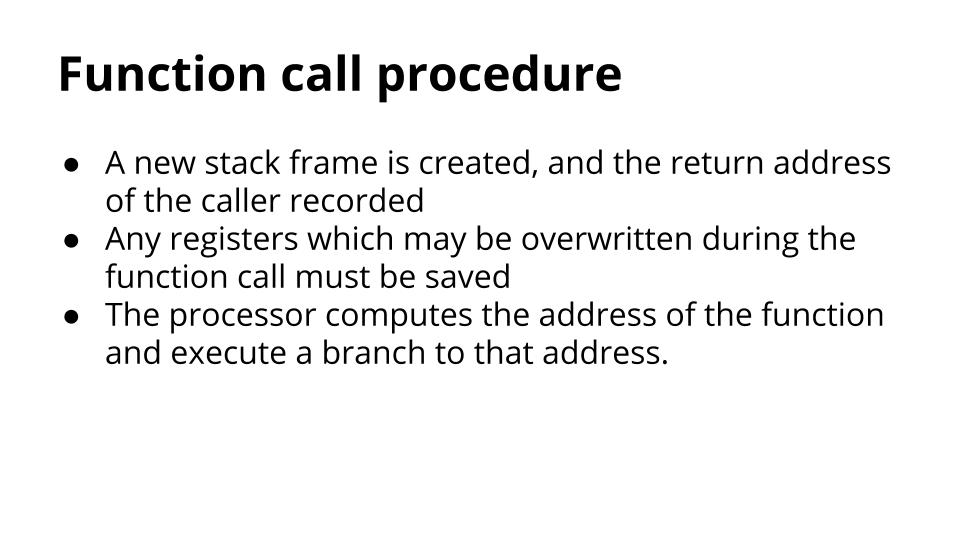
In the previous post I discussed how leaf inlining allows the Go compiler to reduce the overhead of function calls and extend optimisation opportunities across function boundaries. In this post I’ll discuss the limits of inlining and leaf vs mid-stack inlining.

The limits of inlining

Inlining a function into its caller removes the call’s overhead and increases the opportunity for the compiler to apply additional optimisations so the question should be asked, if some inlining is good, would more be better, why not inline as much as possible?

Inlining trades possibly larger program sizes for potentially faster execution time. The main reason to limit inlining is creating many inlined copies of a function can increase compile time and result in larger binaries for marginal gain. Even taking into account the opportunities for further optimisation, aggressive inlining tends to increase the size of, and the time too compile, the resulting binary.

Inlining works best for small functions that do relatively little work compared to the overhead of calling them. As the size of a function grows, the time saved avoiding the call’s overhead diminishes relative to the work done inside the function. Larger functions tend to be more complex, thus the benefits of optimising their inlined forms vs in situ are reduced.

Inlining budget

During compilation each function’s inlineabilty is calculated using what is known as the inlining budget1. The cost calculation can be tricky to internalise but is broadly one unit per node in the AST for simple things like unary and binary operations but can be higher for complex operations like make. Consider this example:

package main

func small() string {
    s := "hello, " + "world!"
    return s
}

func large() string {
    s := "a"
    s += "b"
    s += "c"
    s += "d"
    s += "e"
    s += "f"
    s += "g"
    s += "h"
    s += "i"
    s += "j"
    s += "k"
    s += "l"
    s += "m"
    s += "n"
    s += "o"
    s += "p"
    s += "q"
    s += "r"
    s += "s"
    s += "t"
    s += "u"
    s += "v"
    s += "w"
    s += "x"
    s += "y"
    s += "z"
    return s
}

func main() {
    small()
    large()
}

Compiling this function with -gcflags=-m=2 allows us to see the cost the compiler assigns to each function.

% go build -gcflags=-m=2 inl.go 
# command-line-arguments
./inl.go:3:6: can inline small with cost 7 as: func() string { s := "hello, world!"; return s }
./inl.go:8:6: cannot inline large: function too complex: cost 82 exceeds budget 80
./inl.go:38:6: can inline main with cost 68 as: func() { small(); large() }
./inl.go:39:7: inlining call to small func() string { s := "hello, world!"; return s }

The compiler determined that func small() can be inlined due to its cost of 7. func large() was determined to be too expensive. func main()has been marked as eligible and assigned a cost of 68; 7 from the body of small, 57 from the function call to small and the remainder in its own overhead.

The inlining budget can be controlled to some degree with the -gcflag=-l flag. Currently the values that apply are:

  • -gcflags=-l=0 is the default level of inlining.
  • -gcflags=-l (or -gcflags=-l=1) disables inlining.
  • -gcflags=-l=2 and -gcflags=-l=3 are currently unused and have no effect over -gcflags=-l=0
  • -gcflags=-l=4 reduces the cost for inlining non-leaf functions and calls through interfaces.2

Hairy optimisations

Some functions with a relatively low inlining cost may be ineligible because of their complexity. This is known as the function’s hairiness as the semantics of some operations are hard to reason about once inlined, for example recover, break. Others, like select and go, involve co-ordination with the runtime so the extra effort of inlining doesn’t pay for itself.

The list of hairy statements also includes things like for and range which don’t have an inherently large cost, but simply haven’t been optimised yet.

Mid stack inlining

Historically the Go compiler only performed leaf inlining–only functions which did not call other functions were eligible. In the context of the hairiness discussion previously, a function call would disqualify the function from being inlined.

Enter mid stack inlining which, as its name implies, allows functions in the middle of a call stack to be inlined without requiring everything below them to be eligible. Mid stack inlining was introduced by David Lazar in Go 1.9 and improved in subsequent releases. This presentation goes into some of the difficulties with retaining the behaviour of stack traces and runtime.Callers in code paths that had been heavily inlined.

We see an example of mid-stack inlining in the previous example. After inlining, func main() contains the body of func small() and a call to func large(), thus it is considered a non-leaf function. Historically this would have prevented it from being further inlined even though its combined cost was less than the inlining budget.

The primary use case for mid stack inlining is to reduce the overhead of a path through the call stack. Consider this example:

package main

import (
    "fmt"
    "strconv"
)

type Rectangle struct {}

//go:noinline
func (r *Rectangle) Height() int {
    h, _ := strconv.ParseInt("7", 10, 0)
    return int(h)
}

func (r *Rectangle) Width() int {
    return 6
}

func (r *Rectangle) Area() int { return r.Height() * r.Width() }

func main() {
    var r Rectangle
    fmt.Println(r.Area())
}

In this example r.Area() is a simple function which calls two others. r.Width() can be inlined while r.Height(), simulated here with the //go:noinline annotation, cannot. 3

% go build -gcflags='-m=2' square.go                                                                                                          
# command-line-arguments
./square.go:12:6: cannot inline (*Rectangle).Height: marked go:noinline                                                                               
./square.go:17:6: can inline (*Rectangle).Width with cost 2 as: method(*Rectangle) func() int { return 6 }
./square.go:21:6: can inline (*Rectangle).Area with cost 67 as: method(*Rectangle) func() int { return r.Height() * r.Width() }                       ./square.go:21:61: inlining call to (*Rectangle).Width method(*Rectangle) func() int { return 6 }                                                     
./square.go:23:6: cannot inline main: function too complex: cost 150 exceeds budget 80                        
./square.go:25:20: inlining call to (*Rectangle).Area method(*Rectangle) func() int { return r.Height() * r.Width() }
./square.go:25:20: inlining call to (*Rectangle).Width method(*Rectangle) func() int { return 6 }

As the multiplication performed by r.Area() is cheap compared to the overhead of calling it, inlining r.Area()‘s single expression is a net win even if its downstream caller to r.Height() remains ineligible.

Fast path inlining

The most startling example of the power of mid-stack inlining comes from 2019 when Carlo Alberto Ferraris improved the performance of sync.Mutex.Lock() by allowing the fast path of the lock–the uncontended case–to be inlined into its caller. Prior to this change sync.Mutex.Lock() was a large function containing many hairy conditions which made it ineligible to be inlined. Even in the case where the lock was available, the caller had to pay the overhead of calling sync.Mutex.Lock().

Carlo’s change split sync.Mutex.Lock() into two functions (a process he dubbed outlining). The outer sync.Mutex.Lock() method now calls sync/atomic.CompareAndSwapInt32() and returns to the caller immediately if the CAS succeeds. If not, the function falls through to sync.Mutex.lockSlow() which handles the slow path required to register interest on the lock and park the goroutine.4

% go build -gcflags='-m=2 -l=0' sync 2>&1 | grep '(*Mutex).Lock'
../go/src/sync/mutex.go:72:6: can inline (*Mutex).Lock with cost 69 as: method(*Mutex) func() { if "sync/atomic".CompareAndSwapInt32(&m.state, 0, mutexLocked) { if race.Enabled {  }; return  }; m.lockSlow() }

By splitting the function into an easily inlineable outer function, falling through to a complex inner function to handle the slow path Carlo’s combined mid stack inlining and the compiler’s support for intrinsic operations to reduce the cost of an uncontended lock by 14%. Then he repeated the trick for an additional 9% saving in sync.RWMutex.Unlock().

Inlining optimisations in Go

This is a post about how the Go compiler implements inlining and how this optimisation affects your Go code.

n.b. This article focuses on gc, the de facto Go compiler from golang.org. The concepts discussed apply broadly to other Go compilers like gccgo and tinygo but may differ in implementation and efficacy.

What is inlining?

Inlining is the act of combining smaller functions into their respective callers. In the early days of computing this optimisation was typically performed by hand. Nowadays inlining is one of a class of fundamental optimisations performed automatically during the compilation process.

Why is inlining important?

Inlining is important for two reasons. The first is it removes the overhead of the function call itself. The second is it permits the compiler to more effectively apply other optimisation strategies.

Function call overhead

Calling a function1 in any language carries a cost. There are the overheads of marshalling parameters into registers or onto the stack (depending on the ABI) and reversing the process on return. Invoking a function call involves jumping the program counter from one point in the instruction stream to another which can cause a pipeline stall. Once inside the function there is usually some preamble required to prepare a new stack frame for the function to execute and a similar epilogue needed to retire the frame before returning to the caller.

In Go a function call carries additional costs to support dynamic stack growth. On entry the amount of stack space available to the goroutine is compared to the amount required for the function. If insufficient stack space is available, the preamble jumps into the runtime logic that grows the stack by copying it to a new, larger, location. Once this is done the runtime jumps back to the start of the original function, the stack check is performed again, which now passes, and the call continues. In this way goroutines can start with a small stack allocation which grows only when needed.2

This check is cheap–only a few instructions–and because goroutine stacks grows geometrically the check rarely fails. Thus, the branch prediction unit inside a modern processor can hide the cost of the stack check by assuming it will always be successful. In the case where the processor mis-predicts the stack check and has to discard the work done while it was executing speculatively, the cost of the pipeline stall is relatively small compared to the cost of the work needed for the runtime to grow a goroutines stack.

While the overhead of the generic and Go specific components of each function call are well optimised by modern processors using speculative execution techniques, those overheads cannot be entirely eliminated, thus each function call carries with it a performance cost over and above the time it takes to perform useful work. As a function call’s overhead is fixed, smaller functions pay a larger cost relative to larger ones because they tend to do less useful work per invocation.

The solution to eliminating these overheads must therefore be to eliminate the function call itself, which the Go compiler does, under certain conditions, by replacing the call to a function with the contents of the function. This is known as inlining because it brings the body of the function in line with its caller.

Improved optimisation opportunities

Dr. Cliff Click describes inlining as the optimisation performed by modern compilers as it forms the basis for optimisations like constant propagation and dead code elimination. In effect, inlining allows the compiler to see further, allowing it to observe, in the context that a particular function is being called, logic that can be further simplified or eliminated entirely. As inlining can be applied recursively optimisation decisions can be made not only in the context of each individual function, but also applied to the chain of functions in a call path.

Inlining in action

The effects of inlining can be demonstrated with this small example

package main

import "testing"

//go:noinline
func max(a, b int) int {
    if a > b {
        return a
    }
    return b
}

var Result int

func BenchmarkMax(b *testing.B) {
    var r int
    for i := 0; i < b.N; i++ {
        r = max(-1, i)
    }
    Result = r
}

Running this benchmark gives the following result:3

% go test -bench=. 
BenchmarkMax-4   530687617         2.24 ns/op

The cost of max(-1, i) is around 2.24 nanoseconds on my 2015 MacBook Air. Now let’s remove the //go:noinline pragma and see the result:

% go test -bench=. 
BenchmarkMax-4   1000000000         0.514 ns/op

From 2.24 ns to 0.51 ns, or according to benchstat, a 78% improvement.

% benchstat {old,new}.txt
name   old time/op  new time/op  delta
Max-4  2.21ns ± 1%  0.49ns ± 6%  -77.96%  (p=0.000 n=18+19)

Where did these improvements come from?

First, the removal of the function call and associated preamble4 was a major contributor. Pulling the contents of max into its caller reduced the number of instructions executed by the processor and eliminated several branches.

Now the contents of max are visible to the compiler as it optimises BenchmarkMax it can make some additional improvements. Consider that once max is inlined, this is what the body of BenchmarkMax looks like to the compiler:

func BenchmarkMax(b *testing.B) {
    var r int
    for i := 0; i < b.N; i++ {
        if -1 > i {
            r = -1
        } else {
            r = i
        }
    }
    Result = r
}

Running the benchmark again we see our manually inlined version performs as well as the version inlined by the compiler

% benchstat {old,new}.txt
name   old time/op  new time/op  delta
Max-4  2.21ns ± 1%  0.48ns ± 3%  -78.14%  (p=0.000 n=18+18)

Now the compiler has access to the result of inlining max into BenchmarkMax it can apply optimisation passes which were not possible before. For example, the compiler has noted that i is initialised to 0 and only incremented so any comparison with i can assume i will never be negative. Thus, the condition -1 > i will never be true.5

Having proved that -1 > i will never be true, the compiler can simplify the code to

func BenchmarkMax(b *testing.B) {
    var r int
    for i := 0; i < b.N; i++ {
        if false {
            r = -1
        } else {
            r = i
        }
    }
    Result = r
}

and because the branch is now a constant, the compiler can eliminate the unreachable path leaving it with

func BenchmarkMax(b *testing.B) {
    var r int
    for i := 0; i < b.N; i++ {
        r = i
    }
    Result = r
}

Thus, through inlining and the optimisations it unlocks, the compiler has reduced the expression r = max(-1, i) to simply r = i.

The limits of inlining

In this article I’ve discussed, so called, leaf inlining; the act of inlining a function at the bottom of a call stack into its direct caller. Inlining is a recursive process, once a function has been inlined into its caller, the compiler may inline the resulting code into its caller, as so on. For example, this code

func BenchmarkMaxMaxMax(b *testing.B) {
    var r int
    for i := 0; i < b.N; i++ {
        r = max(max(-1, i), max(0, i))
    }
    Result = r
}

runs as fast as the previous example as the compiler is able to repeatedly apply the optimisations outlined above to reduce the code to the same r = i expression.

In the next article I’ll discuss an alternative inlining strategy when the Go compiler wishes to inline a function in the middle of a call stack. Finally I’ll discuss the limits that the compiler is prepared to go to to inline code, and which Go constructs are currently beyond its capability.

Are large slices more expensive than smaller ones?

Programmers have a tendency to be superstitious. Particularly, when a programmer hears that copies are expensive, they start to see them everywhere, especially when they learn that, in Go, every assignment is a copy.

Consider this code; x is three orders of magnitude larger than y, is the assignment of x to a more expensive than the assignment of y to b?

func f() {
       x, y := make([]byte, 9000), make([]byte, 9)
       a := x
       b := y
       // ...
 } 

The answer is; no. x and y have the same type, []byte, that is, a slice of bytes. As both variables have the same type, their assignment involves copying the same amount of data. Both assignments have the same cost.

All slices are the same size; three machine words (three uintptrs). The first word in the slice is a pointer to the slice’s backing array, the storage for the slice, the second word is the slice’s length, and the third is the capacity. Assigning one slice variable to another copies just three machine words.

Further reading: Go slices: usage and internals (blog.golang.org)

Don’t force allocations on the callers of your API

This is a post about performance. Most of the time when worrying about the performance of a piece of code the overwhelming advice should be (with apologies to Brendan Gregg) don’t worry about it, yet. However there is one area where I counsel developers to think about the performance implications of a design, and that is API design.

Because of the high cost of retrofitting a change to an API’s signature to address performance concerns, it’s worthwhile considering the performance implications of your API’s design on its caller.

A tale of two API designs

Consider these two Read methods:

func (r *Reader) Read(buf []byte) (int, error)
func (r *Reader) Read() ([]byte, error)

The first method takes a []byte buffer and returns the number of bytes read into that buffer and possibly an error that occurred while reading. The second takes no arguments and returns some data as a []byte or an error.

This first method should be familiar to any Go programmer, it’s io.Reader.Read. As ubiquitous as io.Reader is, it’s not the most convenient API to use. Consider for a moment that io.Reader is the only Go interface in widespread use that returns both a result and an error. Meditate on this for a moment. The standard Go idiom, checking the error and iff it is nil is it safe to consult the other return values, does not apply to Read. In fact the caller must do the opposite. First they must record the number of bytes read into the buffer, reslice the buffer, process that data, and only then, consult the error. This is an unusual API for such a common operation and one that frequently catches out newcomers.

A trap for young players?

Why is it so? Why is one of the central APIs in Go’s standard library written like this? A superficial answer might be io.Reader‘s signature is a reflection of the underlying read(2) syscall, which is indeed true, but misses the point of this post.

If we compare the API of io.Reader to our alternative, func Read() ([]byte, error), this API seems easier to use. Each call to Read() will return the data that was read, no need to reslice buffers, no need to remember the special case to do this before checking the error. Yet this is not the signature of io.Reader.Read. Why would one of Go’s most pervasive interfaces choose such an awkward API? The answer, I believe, lies in the performance implications of the APIs signature on the caller.

Consider again our alternative Read function, func Read() ([]byte, error). On each call Read will read some data into a buffer1 and return the buffer to the caller. Where does this buffer come from? Who allocates it? The answer is the buffer is allocated inside Read. Therefore each call to Read is guaranteed to allocate a buffer which would escape to the heap. The more the program reads, the faster it reads data, the more streams of data it reads concurrently, the more pressure it places on the garbage collector.

The standard libraries’ io.Reader.Read forces the caller to supply a buffer because if the caller is concerned with the number of allocations their program is making this is precisely the kind of thing they want to control. Passing a buffer into Read puts the control of the allocations into the caller’s hands. If they aren’t concerned about allocations they can use higher level helpers like ioutil.ReadAll to read the contents into a []byte, or bufio.Scanner to stream the contents instead.

The opposite, starting with a method like our alternative func Read() ([]byte, error) API, prevents callers from pooling or reusing allocations–no amount of helper methods can fix this. As an API author, if the API cannot be changed you’ll be forced to add a second form to your API taking a supplied buffer and reimplementing your original API in terms of the newer form. Consider, for example, io.CopyBuffer. Other examples of retrofitting APIs for performance reasons are the fmt package and the net/http package which drove the introduction of the sync.Pool type precisely because the Go 1 guarantee prevented the APIs of those packages from changing.


If you want to commit to an API for the long run, consider how its design will impact the size and frequency of allocations the caller will have to make to use it.

Go 1.8 toolchain improvements

This is a progress report on the Go toolchain improvements during the 1.8 development cycle.

Now we’re well into November, the 1.8 development window is closing fast on the few remaining in fly change lists, with the remainder being told to wait until the 1.9 development season opens when Go 1.8 ships in February 2017.

For more in this series, read my previous post on the Go 1.8 toolchain improvements from September, and my post on the improvements to the Go toolchain in the 1.7 development cycle.

Faster compilation

Since Go 1.5, released in August 2015, compile times have been significantly slower than Go 1.4. Work on addressing this slow down started in ernest in the Go 1.7 cycle, and is still ongoing.

Robert Griesemer and Matthew Dempsky’s worked on rewriting the parser to make it faster and remove many of the package level variables inherited from the previous yacc based parser. This parser produces a new abstract syntax tree while the rest of the compiler expects the previous yacc syntax tree. For 1.8 the new parser must transform its output into the previous syntax tree for consumption by the rest of the compiler. Even with this extra transformation step the new parser is no slower than the previous version and plans are being made to remove this transformation requirement in Go 1.9.

Compile time for full build relative to Go 1.4.3

Compile time for full build relative to Go 1.4.3

The take away is Go 1.8 is on target to improve compile times by an average of 15% over Go 1.7. Compared to the 3-5% improvements reported two months prior, it’s nice to know that there is still blood in this stone.

Note: The benchmark scripts for jujud, kube-controller-manager, and gogs are online. Please try them yourself and report your findings.

Code generation improvements

The big feature of the previous 1.7 cycle was the new SSA backend for 64 bit Intel. In Go 1.8 the SSA backend has been rolled out to all the other architectures that Go supports and the old backend code has been deleted.

amd64, by virtue of being the most popular production architecture, has always been the fastest. As I reported a few months ago, the results comparing Go 1.8 to Go 1.7 on Intel architectures show middling improvement driven equally by improvements to code generation, escape analysis improvements, and optimisations to the std library.

name                     old time/op    new time/op    delta
BinaryTree17-4              3.04s ± 1%     3.03s ± 0%     ~     (p=0.222 n=5+5)
Fannkuch11-4                3.27s ± 0%     3.39s ± 1%   +3.74%  (p=0.008 n=5+5)
FmtFprintfEmpty-4          60.0ns ± 3%    58.3ns ± 1%   -2.70%  (p=0.008 n=5+5)
FmtFprintfString-4          177ns ± 2%     164ns ± 2%   -7.47%  (p=0.008 n=5+5)
FmtFprintfInt-4             169ns ± 2%     157ns ± 1%   -7.22%  (p=0.008 n=5+5)
FmtFprintfIntInt-4          264ns ± 1%     243ns ± 1%   -8.10%  (p=0.008 n=5+5)
FmtFprintfPrefixedInt-4     254ns ± 2%     244ns ± 1%   -4.02%  (p=0.008 n=5+5)
FmtFprintfFloat-4           357ns ± 1%     348ns ± 2%   -2.35%  (p=0.032 n=5+5)
FmtManyArgs-4              1.10µs ± 1%    0.97µs ± 1%  -11.03%  (p=0.008 n=5+5)
GobDecode-4                9.85ms ± 1%    9.31ms ± 1%   -5.51%  (p=0.008 n=5+5)
GobEncode-4                8.75ms ± 1%    8.17ms ± 1%   -6.67%  (p=0.008 n=5+5)
Gzip-4                      282ms ± 0%     289ms ± 1%   +2.32%  (p=0.008 n=5+5)
Gunzip-4                   50.9ms ± 1%    51.7ms ± 0%   +1.67%  (p=0.008 n=5+5)
HTTPClientServer-4          195µs ± 1%     196µs ± 1%     ~     (p=0.095 n=5+5)
JSONEncode-4               21.6ms ± 6%    19.8ms ± 3%   -8.37%  (p=0.008 n=5+5)
JSONDecode-4               70.2ms ± 3%    71.0ms ± 1%     ~     (p=0.310 n=5+5)
Mandelbrot200-4            5.20ms ± 0%    4.73ms ± 1%   -9.05%  (p=0.008 n=5+5)
GoParse-4                  4.38ms ± 3%    4.28ms ± 2%     ~     (p=0.056 n=5+5)
RegexpMatchEasy0_32-4      96.7ns ± 2%    98.1ns ± 0%     ~     (p=0.127 n=5+5)
RegexpMatchEasy0_1K-4       311ns ± 1%     313ns ± 0%     ~     (p=0.214 n=5+5)
RegexpMatchEasy1_32-4      97.9ns ± 2%    89.8ns ± 2%   -8.33%  (p=0.008 n=5+5)
RegexpMatchEasy1_1K-4       519ns ± 0%     510ns ± 2%   -1.70%  (p=0.040 n=5+5)
RegexpMatchMedium_32-4      158ns ± 2%     146ns ± 0%   -7.71%  (p=0.016 n=5+4)
RegexpMatchMedium_1K-4     46.3µs ± 1%    47.8µs ± 2%   +3.12%  (p=0.008 n=5+5)
RegexpMatchHard_32-4       2.53µs ± 3%    2.46µs ± 0%   -2.91%  (p=0.008 n=5+5)
RegexpMatchHard_1K-4       76.1µs ± 0%    74.5µs ± 2%   -2.12%  (p=0.008 n=5+5)
Revcomp-4                   563ms ± 2%     531ms ± 1%   -5.78%  (p=0.008 n=5+5)
Template-4                 86.7ms ± 1%    82.2ms ± 1%   -5.16%  (p=0.008 n=5+5)
TimeParse-4                 433ns ± 3%     399ns ± 4%   -7.90%  (p=0.008 n=5+5)
TimeFormat-4                467ns ± 2%     430ns ± 1%   -7.76%  (p=0.008 n=5+5)

name                     old speed      new speed      delta
GobDecode-4              77.9MB/s ± 1%  82.5MB/s ± 1%   +5.84%  (p=0.008 n=5+5)
GobEncode-4              87.7MB/s ± 1%  94.0MB/s ± 1%   +7.15%  (p=0.008 n=5+5)
Gzip-4                   68.8MB/s ± 0%  67.2MB/s ± 1%   -2.27%  (p=0.008 n=5+5)
Gunzip-4                  381MB/s ± 1%   375MB/s ± 0%   -1.65%  (p=0.008 n=5+5)
JSONEncode-4             89.9MB/s ± 5%  98.1MB/s ± 3%   +9.11%  (p=0.008 n=5+5)
JSONDecode-4             27.6MB/s ± 3%  27.3MB/s ± 1%     ~     (p=0.310 n=5+5)
GoParse-4                13.2MB/s ± 3%  13.5MB/s ± 2%     ~     (p=0.056 n=5+5)
RegexpMatchEasy0_32-4     331MB/s ± 2%   326MB/s ± 0%     ~     (p=0.151 n=5+5)
RegexpMatchEasy0_1K-4    3.29GB/s ± 1%  3.27GB/s ± 0%     ~     (p=0.222 n=5+5)
RegexpMatchEasy1_32-4     327MB/s ± 2%   357MB/s ± 2%   +9.20%  (p=0.008 n=5+5)
RegexpMatchEasy1_1K-4    1.97GB/s ± 0%  2.01GB/s ± 2%   +1.76%  (p=0.032 n=5+5)
RegexpMatchMedium_32-4   6.31MB/s ± 2%  6.83MB/s ± 1%   +8.31%  (p=0.008 n=5+5)
RegexpMatchMedium_1K-4   22.1MB/s ± 1%  21.4MB/s ± 2%   -3.01%  (p=0.008 n=5+5)
RegexpMatchHard_32-4     12.6MB/s ± 3%  13.0MB/s ± 0%   +2.98%  (p=0.008 n=5+5)
RegexpMatchHard_1K-4     13.4MB/s ± 0%  13.7MB/s ± 2%   +2.19%  (p=0.008 n=5+5)
Revcomp-4                 451MB/s ± 2%   479MB/s ± 1%   +6.12%  (p=0.008 n=5+5)
Template-4               22.4MB/s ± 1%  23.6MB/s ± 1%   +5.43%  (p=0.008 n=5+5)

The big improvements from the switch to the SSA backend show up on non intel architectures. Here are the results for Arm64:

name                     old time/op    new time/op     delta
BinaryTree17-8              10.6s ± 0%       8.1s ± 1%  -23.62%  (p=0.016 n=4+5)
Fannkuch11-8                9.19s ± 0%      5.95s ± 0%  -35.27%  (p=0.008 n=5+5)
FmtFprintfEmpty-8           136ns ± 0%      118ns ± 1%  -13.53%  (p=0.008 n=5+5)
FmtFprintfString-8          472ns ± 1%      331ns ± 1%  -29.82%  (p=0.008 n=5+5)
FmtFprintfInt-8             388ns ± 3%      273ns ± 0%  -29.61%  (p=0.008 n=5+5)
FmtFprintfIntInt-8          640ns ± 2%      438ns ± 0%  -31.61%  (p=0.008 n=5+5)
FmtFprintfPrefixedInt-8     580ns ± 0%      423ns ± 0%  -27.09%  (p=0.008 n=5+5)
FmtFprintfFloat-8           823ns ± 0%      613ns ± 1%  -25.57%  (p=0.008 n=5+5)
FmtManyArgs-8              2.69µs ± 0%     1.96µs ± 0%  -27.12%  (p=0.016 n=4+5)
GobDecode-8                24.4ms ± 0%     17.3ms ± 0%  -28.88%  (p=0.008 n=5+5)
GobEncode-8                18.6ms ± 0%     15.1ms ± 1%  -18.65%  (p=0.008 n=5+5)
Gzip-8                      1.20s ± 0%      0.74s ± 0%  -38.02%  (p=0.008 n=5+5)
Gunzip-8                    190ms ± 0%      130ms ± 0%  -31.73%  (p=0.008 n=5+5)
HTTPClientServer-8          205µs ± 1%      166µs ± 2%  -19.27%  (p=0.008 n=5+5)
JSONEncode-8               50.7ms ± 0%     41.5ms ± 0%  -18.10%  (p=0.008 n=5+5)
JSONDecode-8                201ms ± 0%      155ms ± 1%  -22.93%  (p=0.008 n=5+5)
Mandelbrot200-8            13.0ms ± 0%     10.1ms ± 0%  -22.78%  (p=0.008 n=5+5)
GoParse-8                  11.4ms ± 0%      8.5ms ± 0%  -24.80%  (p=0.008 n=5+5)
RegexpMatchEasy0_32-8       271ns ± 0%      225ns ± 0%  -16.97%  (p=0.008 n=5+5)
RegexpMatchEasy0_1K-8      1.69µs ± 0%     1.92µs ± 0%  +13.42%  (p=0.008 n=5+5)
RegexpMatchEasy1_32-8       292ns ± 0%      255ns ± 0%  -12.60%  (p=0.000 n=4+5)
RegexpMatchEasy1_1K-8      2.20µs ± 0%     2.38µs ± 0%   +8.38%  (p=0.008 n=5+5)
RegexpMatchMedium_32-8      411ns ± 0%      360ns ± 0%  -12.41%  (p=0.000 n=5+4)
RegexpMatchMedium_1K-8      118µs ± 0%      104µs ± 0%  -12.07%  (p=0.008 n=5+5)
RegexpMatchHard_32-8       6.83µs ± 0%     5.79µs ± 0%  -15.27%  (p=0.016 n=4+5)
RegexpMatchHard_1K-8        205µs ± 0%      176µs ± 0%  -14.19%  (p=0.008 n=5+5)
Revcomp-8                   2.01s ± 0%      1.43s ± 0%  -29.02%  (p=0.008 n=5+5)
Template-8                  259ms ± 0%      158ms ± 0%  -38.93%  (p=0.008 n=5+5)
TimeParse-8                 874ns ± 1%      733ns ± 1%  -16.16%  (p=0.008 n=5+5)
TimeFormat-8               1.00µs ± 1%     0.86µs ± 1%  -13.88%  (p=0.008 n=5+5)

name                     old speed      new speed       delta
GobDecode-8              31.5MB/s ± 0%   44.3MB/s ± 0%  +40.61%  (p=0.008 n=5+5)
GobEncode-8              41.3MB/s ± 0%   50.7MB/s ± 1%  +22.92%  (p=0.008 n=5+5)
Gzip-8                   16.2MB/s ± 0%   26.1MB/s ± 0%  +61.33%  (p=0.008 n=5+5)
Gunzip-8                  102MB/s ± 0%    150MB/s ± 0%  +46.45%  (p=0.016 n=4+5)
JSONEncode-8             38.3MB/s ± 0%   46.7MB/s ± 0%  +22.10%  (p=0.008 n=5+5)
JSONDecode-8             9.64MB/s ± 0%  12.49MB/s ± 0%  +29.54%  (p=0.016 n=5+4)
GoParse-8                5.09MB/s ± 0%   6.78MB/s ± 0%  +33.02%  (p=0.008 n=5+5)
RegexpMatchEasy0_32-8     118MB/s ± 0%    142MB/s ± 0%  +20.29%  (p=0.008 n=5+5)
RegexpMatchEasy0_1K-8     605MB/s ± 0%    534MB/s ± 0%  -11.85%  (p=0.016 n=5+4)
RegexpMatchEasy1_32-8     110MB/s ± 0%    125MB/s ± 0%  +14.23%  (p=0.029 n=4+4)
RegexpMatchEasy1_1K-8     465MB/s ± 0%    430MB/s ± 0%   -7.72%  (p=0.008 n=5+5)
RegexpMatchMedium_32-8   2.43MB/s ± 0%   2.77MB/s ± 0%  +13.99%  (p=0.016 n=5+4)
RegexpMatchMedium_1K-8   8.68MB/s ± 0%   9.87MB/s ± 0%  +13.71%  (p=0.008 n=5+5)
RegexpMatchHard_32-8     4.68MB/s ± 0%   5.53MB/s ± 0%  +18.08%  (p=0.016 n=4+5)
RegexpMatchHard_1K-8     5.00MB/s ± 0%   5.83MB/s ± 0%  +16.60%  (p=0.008 n=5+5)
Revcomp-8                 126MB/s ± 0%    178MB/s ± 0%  +40.88%  (p=0.008 n=5+5)
Template-8               7.48MB/s ± 0%  12.25MB/s ± 0%  +63.74%  (p=0.008 n=5+5)

These are pretty big improvements from just recompiling your binary.

Defer and cgo improvements

The question of if defer can be used in hot code paths remains open, but during the 1.8 cycle Austin reduced the overhead of using defer by a half, according to some benchmarks.

The runtime package benchmarks are a little less rosy.

name         old time/op  new time/op  delta
Defer-4       101ns ± 1%    66ns ± 0%  -34.73%  (p=0.000 n=20+20)
Defer10-4    93.2ns ± 1%  62.5ns ± 8%  -33.02%  (p=0.000 n=20+20)
DeferMany-4   148ns ± 3%   131ns ± 3%  -11.42%  (p=0.000 n=19+19)

According to them defer improved by a third in most common circumstances where the statement closes over no more than a single variable.

Additionally, an optimisation by David Crawshaw reduced the overhead of defer in the cgo path by nearly half.

name       old time/op  new time/op  delta
CgoNoop-8  93.5ns ± 0%  51.1ns ± 1%  -45.34%  (p=0.016 n=4+5)

One more thing

Go 1.7 supported 64 bit mips platforms, thanks to the work of Minux and Cherry. However, the less powerful but plentiful, 32 bit mips platforms were not supported. As a bonus, thanks to the work of Vladimir Stefanovic, Go 1.8 will ship will support for 32 bit mips.

% env GOARCH=mips go build -o godoc.mips golang.org/x/tools/cmd/godoc
% file godoc.mips 
godoc.mips: ELF 32-bit MSB  executable, MIPS, MIPS32 version 1 (SYSV), statically linked, not stripped

While 32 bit mips hosts are probably too small to compile Go programs natively, you can always cross compile from your development workstation for linux/mips.

Go 1.8 performance improvements, one month in

Sunday September the 18th marks a month since the Go 1.8 cycle opened officially. I’m passionate about the performance of Go programs, and of the compiler itself. This post is a brief look at the state of play, roughly 1/2 way into the development cycle for Go 1.81.

Note: these results are of course preliminary and represent only a point in time, not the performance of the final Go 1.8 release.

Compile times

Nothing much to report here. Using the methodology from my previous Go 1.7 benchmarks, there is a 3.22%–5.11% improvement in full compile time compared to Go 1.7.

Go 1.4.3, Go 1.7, Go tip

Performance improvements

Intel amd64

Better code generation and small improvements to the runtime and standard library show some small improvements for amd642, but really nothing to write home about yet.

name                       old time/op    new time/op  delta
BinaryTree17-4              3.07s ± 2%     3.06s ± 2%    ~      (p=0.661 n=10+9)
Fannkuch11-4                3.23s ± 1%     3.22s ± 0%  -0.43%   (p=0.008 n=9+10)
FmtFprintfEmpty-4          64.4ns ± 0%    61.8ns ± 4%  -4.17%   (p=0.005 n=9+10)
FmtFprintfString-4          162ns ± 0%     162ns ± 0%    ~      (p=0.065 n=10+9)
FmtFprintfInt-4             142ns ± 0%     142ns ± 0%    ~      (p=0.137 n=8+10)
FmtFprintfIntInt-4          220ns ± 0%     217ns ± 0%  -1.18%   (p=0.000 n=9+10)
FmtFprintfPrefixedInt-4     224ns ± 0%     224ns ± 1%    ~       (p=0.206 n=9+9)
FmtFprintfFloat-4           313ns ± 0%     312ns ± 0%  -0.26%   (p=0.001 n=10+9)
FmtManyArgs-4               906ns ± 0%     894ns ± 0%  -1.32%    (p=0.000 n=7+6)
GobDecode-4                8.88ms ± 1%    8.81ms ± 0%  -0.81%  (p=0.003 n=10+10)
GobEncode-4                7.93ms ± 1%    7.88ms ± 0%  -0.66%   (p=0.008 n=9+10)
Gzip-4                      272ms ± 1%     277ms ± 0%  +1.95%   (p=0.000 n=10+9)
Gunzip-4                   47.4ms ± 0%    47.4ms ± 0%    ~      (p=0.720 n=9+10)
HTTPClientServer-4          201µs ± 4%     202µs ± 2%    ~     (p=0.631 n=10+10)
JSONEncode-4               19.3ms ± 0%    19.3ms ± 0%    ~     (p=0.063 n=10+10)
JSONDecode-4               61.0ms ± 0%    61.2ms ± 0%  +0.33%   (p=0.000 n=10+8)
Mandelbrot200-4            5.20ms ± 0%    5.20ms ± 0%    ~      (p=0.475 n=10+7)
GoParse-4                  3.95ms ± 1%    3.97ms ± 1%  +0.65%    (p=0.003 n=9+9)
RegexpMatchEasy0_32-4      88.4ns ± 0%    88.7ns ± 0%  +0.34%   (p=0.001 n=10+9)
RegexpMatchEasy0_1K-4      1.14µs ± 0%    1.14µs ± 0%    ~       (p=0.369 n=9+6)
RegexpMatchEasy1_32-4      82.6ns ± 0%    82.0ns ± 0%  -0.70%   (p=0.000 n=9+10)
RegexpMatchEasy1_1K-4       469ns ± 0%     463ns ± 0%  -1.23%    (p=0.000 n=6+9)
RegexpMatchMedium_32-4      138ns ± 1%     136ns ± 0%  -1.38%   (p=0.000 n=10+9)
RegexpMatchMedium_1K-4     43.6µs ± 1%    42.0µs ± 0%  -3.74%    (p=0.000 n=9+9)
RegexpMatchHard_32-4       2.25µs ± 1%    2.23µs ± 0%  -0.57%    (p=0.000 n=8+8)
RegexpMatchHard_1K-4       68.8µs ± 0%    68.6µs ± 0%  -0.37%    (p=0.000 n=8+8)
Revcomp-4                   477ms ± 1%     472ms ± 0%  -1.03%    (p=0.000 n=8+8)
Template-4                 76.1ms ± 0%    76.4ms ± 0%  +0.35%    (p=0.000 n=9+9)
TimeParse-4                 367ns ± 0%     366ns ± 0%  -0.16%   (p=0.003 n=10+8)
TimeFormat-4                386ns ± 0%     384ns ± 0%  -0.58%    (p=0.000 n=9+9)

name                     old speed      new speed      delta
GobDecode-4              86.4MB/s ± 1%  87.1MB/s ± 0%  +0.81%  (p=0.003 n=10+10)
GobEncode-4              96.7MB/s ± 1%  97.4MB/s ± 0%  +0.66%   (p=0.007 n=9+10)
Gzip-4                   71.4MB/s ± 1%  70.0MB/s ± 0%  -1.91%   (p=0.000 n=10+9)
Gunzip-4                  409MB/s ± 0%   410MB/s ± 0%    ~      (p=0.703 n=9+10)
JSONEncode-4              101MB/s ± 0%   100MB/s ± 0%    ~     (p=0.084 n=10+10)
JSONDecode-4             31.8MB/s ± 0%  31.7MB/s ± 0%  -0.33%   (p=0.000 n=10+8)
GoParse-4                14.7MB/s ± 1%  14.6MB/s ± 1%  -0.67%    (p=0.002 n=9+9)
RegexpMatchEasy0_32-4     362MB/s ± 0%   361MB/s ± 0%  -0.36%   (p=0.000 n=10+9)
RegexpMatchEasy0_1K-4     898MB/s ± 0%   898MB/s ± 0%    ~       (p=0.762 n=9+8)
RegexpMatchEasy1_32-4     387MB/s ± 0%   390MB/s ± 0%  +0.70%   (p=0.000 n=9+10)
RegexpMatchEasy1_1K-4    2.18GB/s ± 0%  2.21GB/s ± 0%  +1.20%    (p=0.000 n=9+9)
RegexpMatchMedium_32-4   7.23MB/s ± 1%  7.32MB/s ± 0%  +1.19%   (p=0.000 n=10+9)
RegexpMatchMedium_1K-4   23.5MB/s ± 1%  24.4MB/s ± 0%  +3.88%    (p=0.000 n=9+9)
RegexpMatchHard_32-4     14.2MB/s ± 1%  14.3MB/s ± 0%  +0.58%    (p=0.000 n=8+8)
RegexpMatchHard_1K-4     14.9MB/s ± 0%  14.9MB/s ± 0%  +0.34%    (p=0.000 n=8+7)
Revcomp-4                 533MB/s ± 1%   539MB/s ± 0%  +1.04%    (p=0.000 n=8+8)
Template-4               25.5MB/s ± 0%  25.4MB/s ± 0%  -0.36%    (p=0.000 n=9+9)

ARM

The major improvement that landed recently in the development branch is the conversion of the remaining architecture backends to use the compiler’s SSA form. This has brought a substantial improvement in generated code for non Intel architectures, like ARM3.

name                       old time/op    new time/op    delta
BinaryTree17-4              33.8s ± 1%      27.7s ± 0%  -18.06%  (p=0.000 n=10+10)
Fannkuch11-4                42.0s ± 0%      19.3s ± 0%  -54.10%  (p=0.000 n=10+10)
FmtFprintfEmpty-4           670ns ± 1%      581ns ± 1%  -13.30%  (p=0.000 n=10+10)
FmtFprintfString-4         2.04µs ± 1%     1.65µs ± 0%  -19.09%  (p=0.000 n=10+10)
FmtFprintfInt-4            1.71µs ± 0%     1.21µs ± 0%  -29.39%   (p=0.000 n=10+9)
FmtFprintfIntInt-4         2.69µs ± 1%     1.94µs ± 0%  -27.77%  (p=0.000 n=10+10)
FmtFprintfPrefixedInt-4    2.70µs ± 0%     1.85µs ± 0%  -31.41%   (p=0.000 n=10+9)
FmtFprintfFloat-4          5.15µs ± 0%     3.65µs ± 0%  -29.01%   (p=0.000 n=9+10)
FmtManyArgs-4              11.3µs ± 0%      8.5µs ± 0%  -24.79%   (p=0.000 n=10+9)
GobDecode-4                 112ms ± 0%       77ms ± 1%  -31.04%    (p=0.000 n=9+9)
GobEncode-4                88.5ms ± 1%     77.2ms ± 1%  -12.78%  (p=0.000 n=10+10)
Gzip-4                      4.79s ± 0%      3.34s ± 0%  -30.18%    (p=0.000 n=9+9)
Gunzip-4                    702ms ± 0%      463ms ± 0%  -34.05%  (p=0.000 n=10+10)
HTTPClientServer-4          645µs ± 3%      571µs ± 3%  -11.45%  (p=0.000 n=10+10)
JSONEncode-4                227ms ± 0%      186ms ± 0%  -18.16%  (p=0.000 n=10+10)
JSONDecode-4                845ms ± 0%      618ms ± 0%  -26.81%  (p=0.000 n=10+10)
Mandelbrot200-4            59.3ms ± 0%     40.0ms ± 0%  -32.47%  (p=0.000 n=10+10)
GoParse-4                  45.0ms ± 0%     37.0ms ± 0%  -17.68%    (p=0.000 n=9+9)
RegexpMatchEasy0_32-4       974ns ± 0%      878ns ± 0%   -9.81%   (p=0.000 n=10+9)
RegexpMatchEasy0_1K-4      4.60µs ± 0%     4.48µs ± 0%   -2.57%  (p=0.000 n=10+10)
RegexpMatchEasy1_32-4      1.02µs ± 0%     0.94µs ± 0%   -8.08%   (p=0.000 n=8+10)
RegexpMatchEasy1_1K-4      6.92µs ± 0%     6.08µs ± 0%  -12.10%  (p=0.000 n=10+10)
RegexpMatchMedium_32-4     1.61µs ± 0%     1.27µs ± 0%  -20.98%    (p=0.000 n=9+6)
RegexpMatchMedium_1K-4      447µs ± 0%      317µs ± 0%  -29.05%   (p=0.000 n=10+9)
RegexpMatchHard_32-4       24.9µs ± 0%     18.4µs ± 0%  -25.89%  (p=0.000 n=10+10)
RegexpMatchHard_1K-4        740µs ± 0%      552µs ± 0%  -25.36%  (p=0.000 n=10+10)
Revcomp-4                  81.0ms ± 1%     65.2ms ± 0%  -19.53%    (p=0.000 n=9+9)
Template-4                  1.17s ± 0%      0.81s ± 0%  -31.28%    (p=0.000 n=9+9)
TimeParse-4                5.52µs ± 0%     3.79µs ± 0%  -31.42%   (p=0.000 n=10+9)
TimeFormat-4               10.6µs ± 0%      8.5µs ± 0%  -19.14%  (p=0.000 n=10+10)

name                     old speed      new speed        delta
GobDecode-4              6.86MB/s ± 0%   9.95MB/s ± 1%  +45.00%    (p=0.000 n=9+9)
GobEncode-4              8.67MB/s ± 1%   9.94MB/s ± 1%  +14.69%  (p=0.000 n=10+10)
Gzip-4                   4.05MB/s ± 0%   5.81MB/s ± 0%  +43.32%   (p=0.000 n=10+9)
Gunzip-4                 27.6MB/s ± 0%   41.9MB/s ± 0%  +51.63%  (p=0.000 n=10+10)
JSONEncode-4             8.53MB/s ± 0%  10.43MB/s ± 0%  +22.20%  (p=0.000 n=10+10)
JSONDecode-4             2.30MB/s ± 0%   3.14MB/s ± 0%  +36.39%   (p=0.000 n=9+10)
GoParse-4                1.29MB/s ± 0%   1.56MB/s ± 0%  +20.93%   (p=0.000 n=9+10)
RegexpMatchEasy0_32-4    32.8MB/s ± 0%   36.4MB/s ± 0%  +10.87%  (p=0.000 n=10+10)
RegexpMatchEasy0_1K-4     222MB/s ± 0%    228MB/s ± 0%   +2.64%  (p=0.000 n=10+10)
RegexpMatchEasy1_32-4    31.3MB/s ± 0%   34.0MB/s ± 0%   +8.75%   (p=0.000 n=9+10)
RegexpMatchEasy1_1K-4     148MB/s ± 0%    168MB/s ± 0%  +13.76%  (p=0.000 n=10+10)
RegexpMatchMedium_32-4    620kB/s ± 0%    790kB/s ± 0%  +27.42%   (p=0.000 n=10+8)
RegexpMatchMedium_1K-4   2.29MB/s ± 0%   3.23MB/s ± 0%  +41.05%  (p=0.000 n=10+10)
RegexpMatchHard_32-4     1.29MB/s ± 0%   1.74MB/s ± 0%  +34.88%   (p=0.000 n=9+10)
RegexpMatchHard_1K-4     1.38MB/s ± 0%   1.85MB/s ± 0%  +34.06%  (p=0.000 n=10+10)
Revcomp-4                31.4MB/s ± 1%   39.0MB/s ± 0%  +24.26%    (p=0.000 n=9+9)
Template-4               1.65MB/s ± 0%   2.41MB/s ± 0%  +45.71%   (p=0.000 n=10+9)

Notes:

  1. Despite the Go 1.8 development cycle opening 18 days late, in order to keep to the 6 month cadence, the feature freeze for this cycle will still occur on the 1st of November.
  2. Intel(R) Core(TM) i5-2520M CPU @ 2.50GHz, 3.13.0-95-generic #142-Ubuntu
  3. Freescale i.MX6, 3.14.77-1-ARCH

Go 1.7 toolchain improvements

This is a progress report on the Go toolchain improvements during the 1.7 development cycle. All measurements were taken using a Thinkpad x220, Core i5-2520M, running Ubuntu 14.04 linux.

Faster compilation

Since Go 1.5, when the compiler itself was translated from C to Go, compile times are slower than they used to be. Everyone knows it, nobody is happy about it, and we’re working on fixing it.

A huge amount of effort in the 1.7 cycle has gone into reducing the amount of memory and the wall time the compiler uses for various benchmark jobs. The results so far are:

Compile time for full build relative to Go 1.4.3

Compile time for full build relative to Go 1.4.3

Previously I reported the current 1.7 compiler was 2x slower than Go 1.4.3 for the Jujud test. After re-benchmarking everything for this post, the slowdown is closer to 2.2x. Jujud is the largest of the three benchmarks–512 packages, vs 304 and 102 packages respectively–and shows the largest slowdown.

The cmd/go result is a little misleading as the code being compiled changes with every release, vs the fixed codebases of the other benchmarks.

Note: The benchmark scripts for jujud, kube-controller-manager, and gogs are online. Please try them yourself and report your findings.

Improved linker performance

A significant part of the build time improvements observed above come from improvements to the linker. Relative to Go 1.6, the linker is now roughly 66% faster.

Link time relative to Go 1.4.3

Link time relative to Go 1.4.3

Relative to Go 1.4.3, linking is 10% faster for any non trivial binary, and up to 30% faster for large binaries like jujud. These figures are for ELF targets only, Mach-o and PE targets have not improved as much.

This isn’t just useful for building final binaries. A faster linker improves the edit/compile/test cycle as each test is itself a program that must be linked and run. Anecdotally the linker now uses a third less memory, which is valuable when linking large binaries.

Smaller binaries

With code generation and linker improvements, binaries produced by the tip compiler are substantially smaller than Go 1.6. This work has been spearheaded by David Crawshaw.

Binary sizes

Binary size (bytes)

At this point, with the exception of its own cmd/go tool, Go 1.7 produces smaller binaries than Go 1.4.3.

Code generation improvements

The big feature for the Go 1.7 cycle is the new SSA backend for 64bit Intel.

While not the focus of this post, it would be remiss not to include some information about performance improvements in compiled code (not just the compiler’s code). Stressing of course that these are preliminary figures as there is still four months to go before the new backend becomes the default for amd64.

Go 1 benchmarks, Go 1.6 vs 683448a

Go 1 benchmarks, Go 1.6 vs 683448a

These numbers match the figures reported by Keith Randall a few weeks ago, and are in line with his thesis in the SSA design doc.

I think it would be fairly easy to make the generated programs 20% smaller and 10% faster. — khr

These improvements are not just the work of the SSA backend. The standard library and garbage collector continue to see improvements, including a 20% improvement to the fmt package by Martin Möhrmann. These benefits flow to all the platforms that Go supports.

The sole regression above is caused by a current limitation in the register optimiser which manages to registerise one less variable in the Mandelbrot inner loop.

Looking ahead

According to the release schedule, approximately one month remains before the 1.7 change window closes and the dev cycle enters the bug fix phase. There is still lots of work to do, but the improvements so far will easily make Go 1.7 the best Go release to date.

Visualising the Go garbage collector

Update this post is also available in Japanese.

This is a post about an experimental tool that I have been working on.

gcvis is a simple way of visualising the operation of the garbage collector within a Go process. Here is a screenshot of it in operation.
gcvis
The rest of this article explores how gcvis works and how to interpret its results.

How does gcvis get the data ?

There are a few ways you can interrogate a Go program.

You could use the built in profiler, via the net/http/pprof package, or my profile package. However this means modifying the source of the program, which sometimes may not be an option.

There is another source of telemetry data built into every Go program which is accessible by setting the following environment variable.

GODEBUG=gctrace=1

(The GODEBUG environment variable is documented in the runtime package).

When your program is started with this environment variable set, the following additional output will be printed to standard out (slightly abridged)

 % env GODEBUG=gctrace=1 godoc -http=:6060
...
gc76(1): 2+1+1390+1 us, 1 -> 3 MB, 16397 (1015746-999349) objects, 1436/1/0 sweeps, 0(0) handoff, 0(0) steal, 0/0/0 yields
gc77(1): 2+0+1582+1 us, 2 -> 4 MB, 14623 (1016248-1001625) objects, 1436/0/0 sweeps, 0(0) handoff, 0(0) steal, 0/0/0 yields
scvg0: inuse: 6, idle: 15, sys: 22, released: 0, consumed: 22 (MB)
scvg1: inuse: 6, idle: 15, sys: 22, released: 0, consumed: 22 (MB)
gc78(1): 5+1+4814+1 us, 2 -> 2 MB, 21076 (1023168-1002092) objects, 1436/25/0 sweeps, 0(0) handoff, 0(0) steal, 0/0/0 yields
scvg2: GC forced
scvg2: inuse: 6, idle: 15, sys: 22, released: 0, consumed: 22 (MB)

The two types of information presented are

  • A line for every garbage collection cycle, indicated by the gc prefix.
  • A set of lines for the operation of the scavenger, indicated by the scvg prefix, which is responsible for returning unused portions of the heap to the operating system.

In the next section I will discuss using, and interpreting the data from, gcvis.

Using gcvis

To use gcvis, place it in front of the Go program you want to inspect, as you would time or nice.

Here is an example of using gcvis with godoc in indexing mode (so it uses lots of memory and cpu time, generating interesting data).

% gcvis godoc -index -http=:6060
2014/07/11 16:29:12 opening browser window, if this fails, navigate to http://127.0.0.1:53267/
Created new window in existing browser session.

That’s it.

gcvis takes care of setting the appropriate value of GODEBUG and filtering out the additional information generated. gcvis also tries to open a browser window to view the visualisation. This functionality is provided by pkg/browser and is somewhat operating system dependent.

Because gcvis is recording the gc debug lines in real time, it can add timestamp information to them, a feature which is currently missing from that raw GODEBUG output.

Screenshot from 2014-07-11 16:35:09
In this example you can see the frequency of gc cycles decrease as the heap grows.

The main use of the gc debug data is to record the size of the live objects on the heap, however this doesn’t reveal the total size of the heap, nor what percentage of the heap the live set represents. For that we need to add the debugging information from the scavenger.

The scavenger runs on a timer, currently every two minutes, so will only start to report its data to gcviz a few minutes after the program starts. Here is an example after running for about 15 minutes.

Screenshot from 2014-07-11 17:01:31
Some interesting points to note in this graph are

  • scvg.sys represents the total amount of memory requested from the operating system, this is roughly analogous to the VSS value reported by tools like top.
  • scvg.inuse is the amount of memory in use by the whole heap, which may include dead objects. scvg.inuse and gc.heapinuse may not track each other exactly as they are reported at different times.
  • scvg.idle represents memory that is currently unused by the garbage collector, that is, used to contain dead objects, but is now unused after garbage collection.
  • When the scavenger runs, scvg.idle grows as scvg.inuse shrinks.
  • If memory remains idle for long enough the scavenger will inform the operating system that it is no longer needed, this is reported by scvg.released and matches a drop in scvg.consumedThe operating system is free to ignore this request, and frequently does.

Conclusion

The code is open source on Github, so go get it and try it on your application.

go get -u -v github.com/davecheney/gcvis

I’m very keen to hear from other Go users if gcvis is useful for you. Pull requests and bug reports are also most welcome.

A special thanks to Damian Gryski, Matthew Holt, and Bill Kennedy, for their suggestions and feedback.

Five things that make Go fast

Anthony Starks has remixed my original Google Present based slides using his fantastic Deck presentation tool. You can check out his remix over on his blog, mindchunk.blogspot.com.au/2014/06/remixing-with-deck.


I was recently invited to give a talk at Gocon, a fantastic Go conference held semi-annually in Tokyo, Japan. Gocon 2014 was an entirely community-run one day event combining training and an afternoon of presentations surrounding the theme of Go in production.

The following is the text of my presentation. The original text was structured to force me to speak slowly and clearly, so I have taken the liberty of editing it slightly to be more readable.

I want to thank Bill Kennedy, Minux Ma, and especially Josh Bleecher Snyder, for their assistance in preparing this talk.


Good afternoon.

My name is David.

I am delighted to be here at Gocon today. I have wanted to come to this conference for two years and I am very grateful to the organisers for extending me the opportunity to present to you today.

Gocon 2014
I want to begin my talk with a question.

Why are people choosing to use Go ?

When people talk about their decision to learn Go, or use it in their product, they have a variety of answers, but there always three that are at the top of their list

Gocon 2014
These are the top three.

The first, Concurrency.

Go’s concurrency primitives are attractive to programmers who come from single threaded scripting languages like Nodejs, Ruby, or Python, or from languages like C++ or Java with their heavyweight threading model.

Ease of deployment.

We have heard today from experienced Gophers who appreciate the simplicity of deploying Go applications.

Gocon 2014

This leaves Performance.

I believe an important reason why people choose to use Go is because it is fast.

Gocon 2014 (4)

For my talk today I want to discuss five features that contribute to Go’s performance.

I will also share with you the details of how Go implements these features.

Gocon 2014 (5)

The first feature I want to talk about is Go’s efficient treatment and storage of values.

Gocon 2014 (6)

This is an example of a value in Go. When compiled, gocon consumes exactly four bytes of memory.

Let’s compare Go with some other languages

Gocon 2014 (7)

Due to the overhead of the way Python represents variables, storing the same value using Python consumes six times more memory.

This extra memory is used by Python to track type information, do reference counting, etc

Let’s look at another example:

Gocon 2014 (8)

Similar to Go, the Java int type consumes 4 bytes of memory to store this value.

However, to use this value in a collection like a List or Map, the compiler must convert it into an Integer object.

Gocon 2014 (9)

So an integer in Java frequently looks more like this and consumes between 16 and 24 bytes of memory.

Why is this important ? Memory is cheap and plentiful, why should this overhead matter ?

Gocon 2014 (10)

This is a graph showing CPU clock speed vs memory bus speed.

Notice how the gap between CPU clock speed and memory bus speed continues to widen.

The difference between the two is effectively how much time the CPU spends waiting for memory.

Gocon 2014 (11)

Since the late 1960’s CPU designers have understood this problem.

Their solution is a cache, an area of smaller, faster memory which is inserted between the CPU and main memory.

Gocon 2014 (12)

This is a Location type which holds the location of some object in three dimensional space. It is written in Go, so each Location consumes exactly 24 bytes of storage.

We can use this type to construct an array type of 1,000 Locations, which consumes exactly 24,000 bytes of memory.

Inside the array, the Location structures are stored sequentially, rather than as pointers to 1,000 Location structures stored randomly.

This is important because now all 1,000 Location structures are in the cache in sequence, packed tightly together.

Gocon 2014 (13)

Go lets you create compact data structures, avoiding unnecessary indirection.

Compact data structures utilise the cache better.

Better cache utilisation leads to better performance.

Gocon 2014 (14)

Function calls are not free.

Gocon 2014 (15)

Three things happen when a function is called.

A new stack frame is created, and the details of the caller recorded.

Any registers which may be overwritten during the function call are saved to the stack.

The processor computes the address of the function and executes a branch to that new address.

Gocon 2014 (16)

Because function calls are very common operations, CPU designers have worked hard to optimise this procedure, but they cannot eliminate the overhead.

Depending on what the function does, this overhead may be trivial or significant.

A solution to reducing function call overhead is an optimisation technique called Inlining.

Gocon 2014 (17)

The Go compiler inlines a function by treating the body of the function as if it were part of the caller.

Inlining has a cost; it increases binary size.

It only makes sense to inline when the overhead of calling a function is large relative to the work the function does, so only simple functions are candidates for inlining.

Complicated functions are usually not dominated by the overhead of calling them and are therefore not inlined.

Gocon 2014 (18)

This example shows the function Double calling util.Max.

To reduce the overhead of the call to util.Max, the compiler can inline util.Max into Double, resulting in something like this

Gocon 2014 (19)

After inlining there is no longer a call to util.Max, but the behaviour of Double is unchanged.

Inlining isn’t exclusive to Go. Almost every compiled or JITed language performs this optimisation. But how does inlining in Go work?

The Go implementation is very simple. When a package is compiled, any small function that is suitable for inlining is marked and then compiled as usual.

Then both the source of the function and the compiled version are stored.

Gocon 2014 (20)

This slide shows the contents of util.a. The source has been transformed a little to make it easier for the compiler to process quickly.

When the compiler compiles Double it sees that util.Max is inlinable, and the source of util.Max is available.

Rather than insert a call to the compiled version of util.Max, it can substitute the source of the original function.

Having the source of the function enables other optimizations.

Gocon 2014 (21)

In this example, although the function Test always returns false, Expensive cannot know that without executing it.

When Test is inlined, we get something like this

Gocon 2014 (22)

The compiler now knows that the expensive code is unreachable.

Not only does this save the cost of calling Test, it saves compiling or running any of the expensive code that is now unreachable.

The Go compiler can automatically inline functions across files and even across packages. This includes code that calls inlinable functions from the standard library.

Gocon 2014 (23)

Mandatory garbage collection makes Go a simpler and safer language.

This does not imply that garbage collection makes Go slow, or that garbage collection is the ultimate arbiter of the speed of your program.

What it does mean is memory allocated on the heap comes at a cost. It is a debt that costs CPU time every time the GC runs until that memory is freed.

Gocon 2014 (24)

There is however another place to allocate memory, and that is the stack.

Unlike C, which forces you to choose if a value will be stored on the heap, via malloc, or on the stack, by declaring it inside the scope of the function, Go implements an optimisation called escape analysis.

Gocon 2014 (25)

Escape analysis determines whether any references to a value escape the function in which the value is declared.

If no references escape, the value may be safely stored on the stack.

Values stored on the stack do not need to be allocated or freed.

Lets look at some examples

Gocon 2014 (26)

Sum adds the numbers between 1 and 100 and returns the result. This is a rather unusual way to do this, but it illustrates how Escape Analysis works.

Because the numbers slice is only referenced inside Sum, the compiler will arrange to store the 100 integers for that slice on the stack, rather than the heap.

There is no need to garbage collect numbers, it is automatically freed when Sum returns.

Gocon 2014 (27)

This second example is also a little contrived. In CenterCursor we create a new Cursor and store a pointer to it in c.

Then we pass c to the Center() function which moves the Cursor to the center of the screen.

Then finally we print the X and Y locations of that Cursor.

Even though c was allocated with the new function, it will not be stored on the heap, because no reference c escapes the CenterCursor function.

Gocon 2014 (28)

Go’s optimisations are always enabled by default. You can see the compiler’s escape analysis and inlining decisions with the -gcflags=-m switch.

Because escape analysis is performed at compile time, not run time, stack allocation will always be faster than heap allocation, no matter how efficient your garbage collector is.

I will talk more about the stack in the remaining sections of this talk.

Gocon 2014 (30)

Go has goroutines. These are the foundations for concurrency in Go.

I want to step back for a moment and explore the history that leads us to goroutines.

In the beginning computers ran one process at a time. Then in the 60’s the idea of multiprocessing, or time sharing became popular.

In a time-sharing system the operating systems must constantly switch the attention of the CPU between these processes by recording the state of the current process, then restoring the state of another.

This is called process switching.

Gocon 2014 (29)

There are three main costs of a process switch.

First is the kernel needs to store the contents of all the CPU registers for that process, then restore the values for another process.

The kernel also needs to flush the CPU’s mappings from virtual memory to physical memory as these are only valid for the current process.

Finally there is the cost of the operating system context switch, and the overhead of the scheduler function to choose the next process to occupy the CPU.

Gocon 2014 (31)

There are a surprising number of registers in a modern processor. I have difficulty fitting them on one slide, which should give you a clue how much time it takes to save and restore them.

Because a process switch can occur at any point in a process’ execution, the operating system needs to store the contents of all of these registers because it does not know which are currently in use.

Gocon 2014 (32)

This lead to the development of threads, which are conceptually the same as processes, but share the same memory space.

As threads share address space, they are lighter than processes so are faster to create and faster to switch between.

Gocon 2014 (33)

Goroutines take the idea of threads a step further.

Goroutines are cooperatively scheduled, rather than relying on the kernel to manage their time sharing.

The switch between goroutines only happens at well defined points, when an explicit call is made to the Go runtime scheduler.

The compiler knows the registers which are in use and saves them automatically.

Gocon 2014 (34)

While goroutines are cooperatively scheduled, this scheduling is handled for you by the runtime.

Places where Goroutines may yield to others are:

  • Channel send and receive operations, if those operations would block.
  • The Go statement, although there is no guarantee that new goroutine will be scheduled immediately.
  • Blocking syscalls like file and network operations.
  • After being stopped for a garbage collection cycle.

Gocon 2014 (35)

This an example to illustrate some of the scheduling points described in the previous slide.

The thread, depicted by the arrow, starts on the left in the ReadFile function. It encounters os.Open, which blocks the thread while waiting for the file operation to complete, so the scheduler switches the thread to the goroutine on the right hand side.

Execution continues until the read from the c chan blocks, and by this time the os.Open call has completed so the scheduler switches the thread back the left hand side and continues to the file.Read function, which again blocks on file IO.

The scheduler switches the thread back to the right hand side for another channel operation, which has unblocked during the time the left hand side was running, but it blocks again on the channel send.

Finally the thread switches back to the left hand side as the Read operation has completed and data is available.

Gocon 2014 (36)

This slide shows the low level runtime.Syscall function which is the base for all functions in the os package.

Any time your code results in a call to the operating system, it will go through this function.

The call to entersyscall informs the runtime that this thread is about to block.

This allows the runtime to spin up a new thread which will service other goroutines while this current thread blocked.

This results in relatively few operating system threads per Go process, with the Go runtime taking care of assigning a runnable Goroutine to a free operating system thread.

Gocon 2014 (37)

In the previous section I discussed how goroutines reduce the overhead of managing many, sometimes hundreds of thousands of concurrent threads of execution.

There is another side to the goroutine story, and that is stack management, which leads me to my final topic.

Gocon 2014 (39)

This is a diagram of the memory layout of a process. The key thing we are interested is the location of the heap and the stack.

Traditionally inside the address space of a process, the heap is at the bottom of memory, just above the program (text) and grows upwards.

The stack is located at the top of the virtual address space, and grows downwards.

Gocon 2014 (40)

Because the heap and stack overwriting each other would be catastrophic, the operating system usually arranges to place an area of unwritable memory between the stack and the heap to ensure that if they did collide, the program will abort.

This is called a guard page, and effectively limits the stack size of a process, usually in the order of several megabytes.

Gocon 2014 (41)

We’ve discussed that threads share the same address space, so for each thread, it must have its own stack.

Because it is hard to predict the stack requirements of a particular thread, a large amount of memory is reserved for each thread’s stack along with a guard page.

The hope is that this is more than will ever be needed and the guard page will never be hit.

The downside is that as the number of threads in your program increases, the amount of available address space is reduced.

Gocon 2014 (42)

We’ve seen that the Go runtime schedules a large number of goroutines onto a small number of threads, but what about the stack requirements of those goroutines ?

Instead of using guard pages, the Go compiler inserts a check as part of every function call to check if there is sufficient stack for the function to run. If there is not, the runtime can allocate more stack space.

Because of this check, a goroutines initial stack can be made much smaller, which in turn permits Go programmers to treat goroutines as cheap resources.

Gocon 2014 (43)

This is a slide that shows how stacks are managed in Go 1.2.

When G calls to H there is not enough space for H to run, so the runtime allocates a new stack frame from the heap, then runs H on that new stack segment. When H returns, the stack area is returned to the heap before returning to G.

Gocon 2014 (44)

This method of managing the stack works well in general, but for certain types of code, usually recursive code, it can cause the inner loop of your program to straddle one of these stack boundaries.

For example, in the inner loop of your program, function G may call H many times in a loop,

Each time this will cause a stack split. This is known as the hot split problem.

Gocon 2014 (45)

To solve hot splits, Go 1.3 has adopted a new stack management method.

Instead of adding and removing additional stack segments, if the stack of a goroutine is too small, a new, larger, stack will be allocated.

The old stack’s contents are copied to the new stack, then the goroutine continues with its new larger stack.

After the first call to H the stack will be large enough that the check for available stack space will always succeed.

This resolves the hot split problem.

Gocon 2014 (46)

Values, Inlining, Escape Analysis, Goroutines, and segmented/copying stacks.

These are the five features that I chose to speak about today, but they are by no means the only things that makes Go a fast programming language, just as there more that three reasons that people cite as their reason to learn Go.

As powerful as these five features are individually, they do not exist in isolation.

For example, the way the runtime multiplexes goroutines onto threads would not be nearly as efficient without growable stacks.

Inlining reduces the cost of the stack size check by combining smaller functions into larger ones.

Escape analysis reduces the pressure on the garbage collector by automatically moving allocations from the heap to the stack.

Escape analysis is also provides better cache locality.

Without growable stacks, escape analysis might place too much pressure on the stack.

Gocon 2014 (47)

* Thank you to the Gocon organisers for permitting me to speak today
* twitter / web / email details
* thanks to @offbymany, @billkennedy_go, and Minux for their assistance in preparing this talk.

autobench-next updated for Go 1.3

Now that go1.3beta1 has been released I’ve updated the autobench-next branch to track Go 1.2 vs tip (go1.3beta1).

Using autobench is very simple, clone the repository and run make to produce a benchmark on your machine.

% cd devel
% git clone -b autobench-next https://github.com/davecheney/autobench.git
% cd autobench
% make

You can stay up to date with the update target

% git pull 
% make update
% make

Contributions and benchmark results are always welcome. As the Go 1.3 cycle draws to a close I will merge this branch back into master replacing the older 1.1 vs 1.2 comparisons.