Update this post is also available in Japanese.
This is a post about an experimental tool that I have been working on.
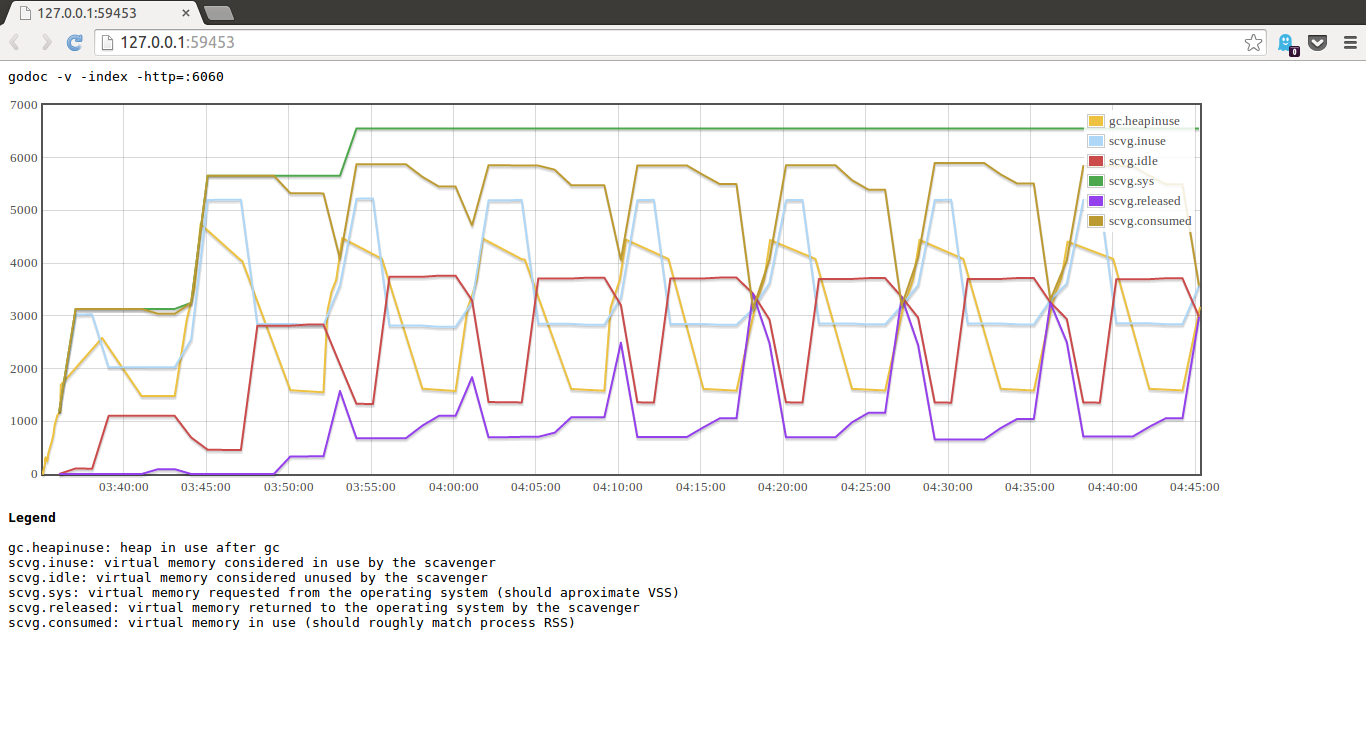
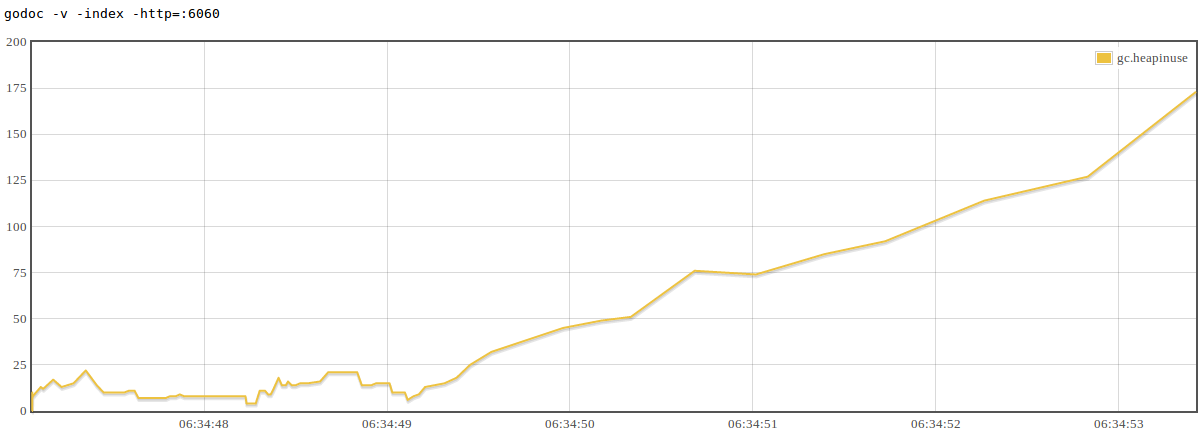
gcvis is a simple way of visualising the operation of the garbage collector within a Go process. Here is a screenshot of it in operation.

The rest of this article explores how gcvis works and how to interpret its results.
How does gcvis get the data ?
There are a few ways you can interrogate a Go program.
You could use the built in profiler, via the net/http/pprof package, or my profile package. However this means modifying the source of the program, which sometimes may not be an option.
There is another source of telemetry data built into every Go program which is accessible by setting the following environment variable.
GODEBUG=gctrace=1
(The GODEBUG environment variable is documented in the runtime package).
When your program is started with this environment variable set, the following additional output will be printed to standard out (slightly abridged)
 % env GODEBUG=gctrace=1 godoc -http=:6060
...
gc76(1): 2+1+1390+1 us, 1 -> 3 MB, 16397 (1015746-999349) objects, 1436/1/0 sweeps, 0(0) handoff, 0(0) steal, 0/0/0 yields
gc77(1): 2+0+1582+1 us, 2 -> 4 MB, 14623 (1016248-1001625) objects, 1436/0/0 sweeps, 0(0) handoff, 0(0) steal, 0/0/0 yields
scvg0: inuse: 6, idle: 15, sys: 22, released: 0, consumed: 22 (MB)
scvg1: inuse: 6, idle: 15, sys: 22, released: 0, consumed: 22 (MB)
gc78(1): 5+1+4814+1 us, 2 -> 2 MB, 21076 (1023168-1002092) objects, 1436/25/0 sweeps, 0(0) handoff, 0(0) steal, 0/0/0 yields
scvg2: GC forced
scvg2: inuse: 6, idle: 15, sys: 22, released: 0, consumed: 22 (MB)
The two types of information presented are
- A line for every garbage collection cycle, indicated by the
gcprefix. - A set of lines for the operation of the scavenger, indicated by the
scvgprefix, which is responsible for returning unused portions of the heap to the operating system.
In the next section I will discuss using, and interpreting the data from, gcvis.
Using gcvis
To use gcvis, place it in front of the Go program you want to inspect, as you would time or nice.
Here is an example of using gcvis with godoc in indexing mode (so it uses lots of memory and cpu time, generating interesting data).
% gcvis godoc -index -http=:6060
2014/07/11 16:29:12 opening browser window, if this fails, navigate to http://127.0.0.1:53267/
Created new window in existing browser session.
That’s it.
gcvis takes care of setting the appropriate value of GODEBUG and filtering out the additional information generated. gcvis also tries to open a browser window to view the visualisation. This functionality is provided by pkg/browser and is somewhat operating system dependent.
Because gcvis is recording the gc debug lines in real time, it can add timestamp information to them, a feature which is currently missing from that raw GODEBUG output.

In this example you can see the frequency of gc cycles decrease as the heap grows.
The main use of the gc debug data is to record the size of the live objects on the heap, however this doesn’t reveal the total size of the heap, nor what percentage of the heap the live set represents. For that we need to add the debugging information from the scavenger.
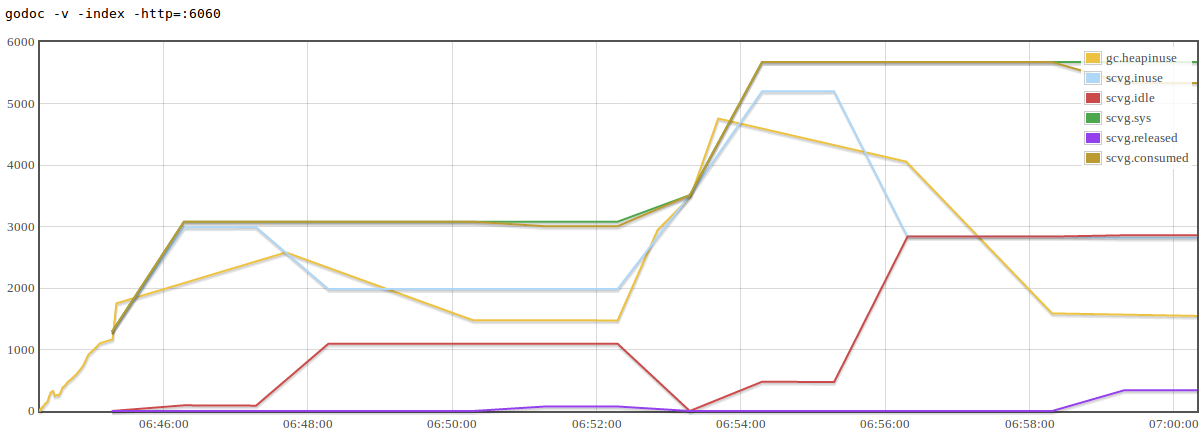
The scavenger runs on a timer, currently every two minutes, so will only start to report its data to gcviz a few minutes after the program starts. Here is an example after running for about 15 minutes.

Some interesting points to note in this graph are
scvg.sysrepresents the total amount of memory requested from the operating system, this is roughly analogous to the VSS value reported by tools liketop.scvg.inuseis the amount of memory in use by the whole heap, which may include dead objects.scvg.inuseandgc.heapinusemay not track each other exactly as they are reported at different times.scvg.idlerepresents memory that is currently unused by the garbage collector, that is, used to contain dead objects, but is now unused after garbage collection.- When the scavenger runs,
scvg.idlegrows asscvg.inuseshrinks. - If memory remains idle for long enough the scavenger will inform the operating system that it is no longer needed, this is reported by
scvg.releasedand matches a drop inscvg.consumed. The operating system is free to ignore this request, and frequently does.
Conclusion
The code is open source on Github, so go get it and try it on your application.
go get -u -v github.com/davecheney/gcvis
I’m very keen to hear from other Go users if gcvis is useful for you. Pull requests and bug reports are also most welcome.
A special thanks to Damian Gryski, Matthew Holt, and Bill Kennedy, for their suggestions and feedback.
definitely useful. Beats having to insert `runtime.MemStats` everywhere and then logging it and writing a server to tail a log file. Thanks for this.
I haven’t studied the implementation closely, but would it be possible to extract object tenure or heap/span fragmentation information from the runtime, or is the reporting basically constrained to what
runtime.Memstatsand the base information the collector presently offer?The latter.