Monthly Archives: July 2014

Arduino SPI woes

A few months ago I upgraded the hardware my avr11 project ran on from the atmega2560 8bit micro to the SAM3x based Arduino Due. In doing so I lost access to the excellent QuadRAM memory expansion board, and had to find another solution for accessing the micro SD card.

For the moment, I’ve decided to go back to my SPI based SRAM shield that I built previously and this means I need to hook both the SPI SRAM shield and a Sparkfun micro SD card shield up to the Arduino Due.

Sparkfun micro SD card shield

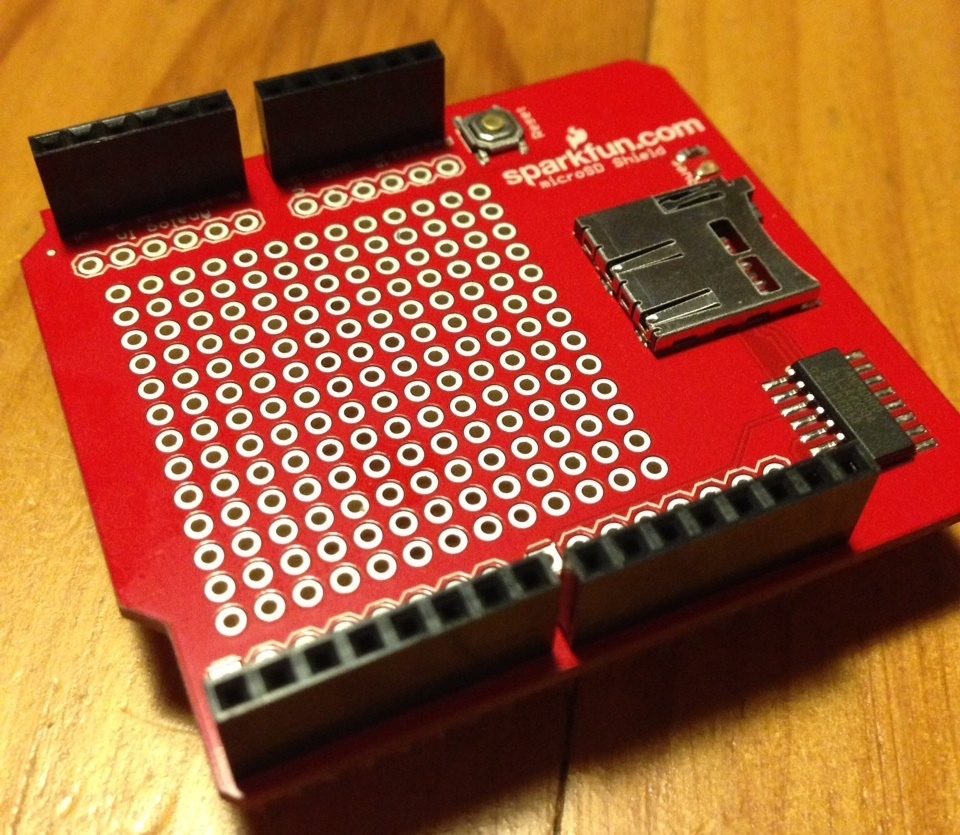
Sparkfun micro SD card shield, no ICSP header connector.

This brings me to the topic for this post; why do Arduino keep moving the SPI pins!

In the beginning there was the Arduino Uno form factor, SPI was available on both pins 11, 12 and 13 as well as the dedicated ICSP header.

Arduino Uno

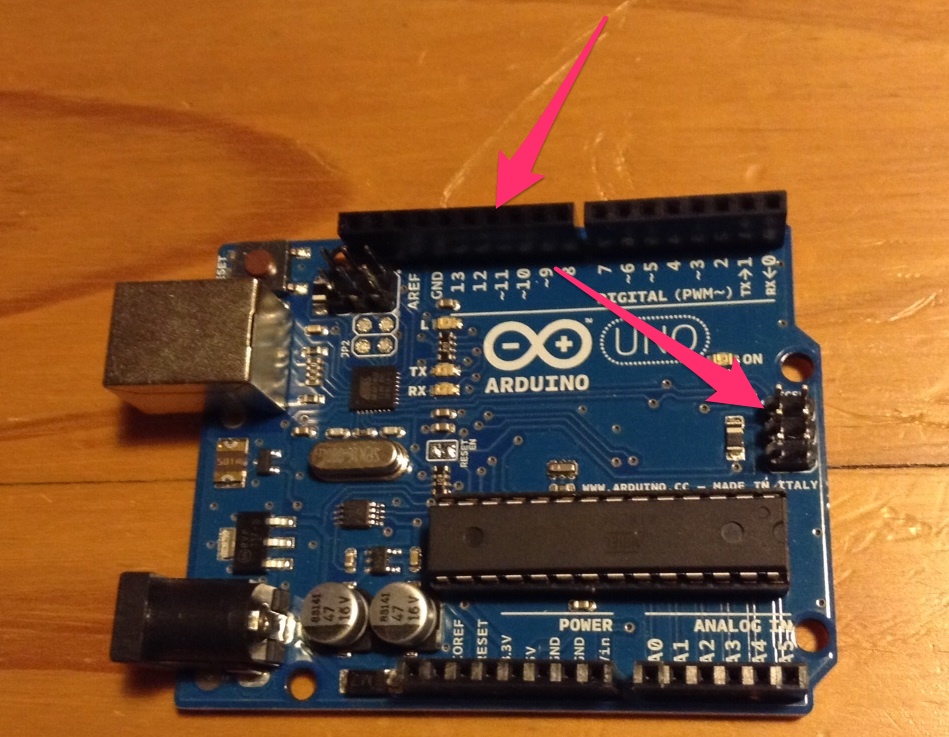
SPI is available on pins 11, 12 and 13, as well as the ICSP header.

Then the Arduino mega platform came out, with the Atmel 2560 chipset and the larger shield sizes.

Freetronics Ethermega 2560

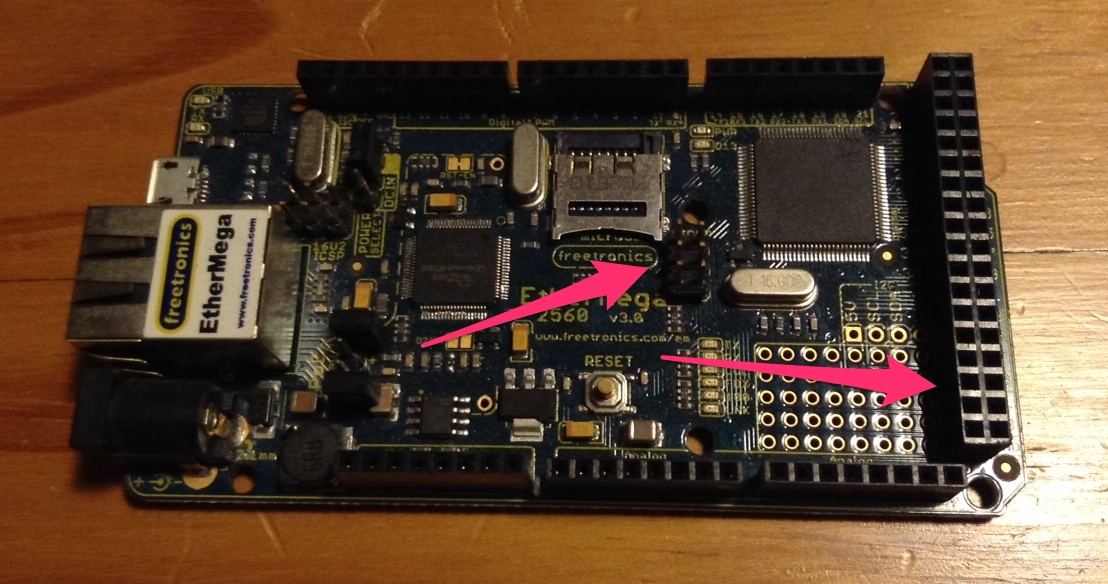
SPI has moved to pins 51, 52 and 53, as well as the ICSP header.

SPI is no longer available on pins 11, 12 and 13, but has moved to pins 51, 52 and 32. It remains available on the ICSP header, which is the area that Arduino is pushing shield makers to use. Unfortunately shield makers are steadfastly ignoring the recommendations from Arduino and none of the SD card shields I ca find have a connector to route the ICSP header upwards as you add additional shields. The blanks shields from Freetronics don’t even make it an option.

This brings me to the Arduino Due, which I needed to get the grunt to run my avr11 simulator.

Due

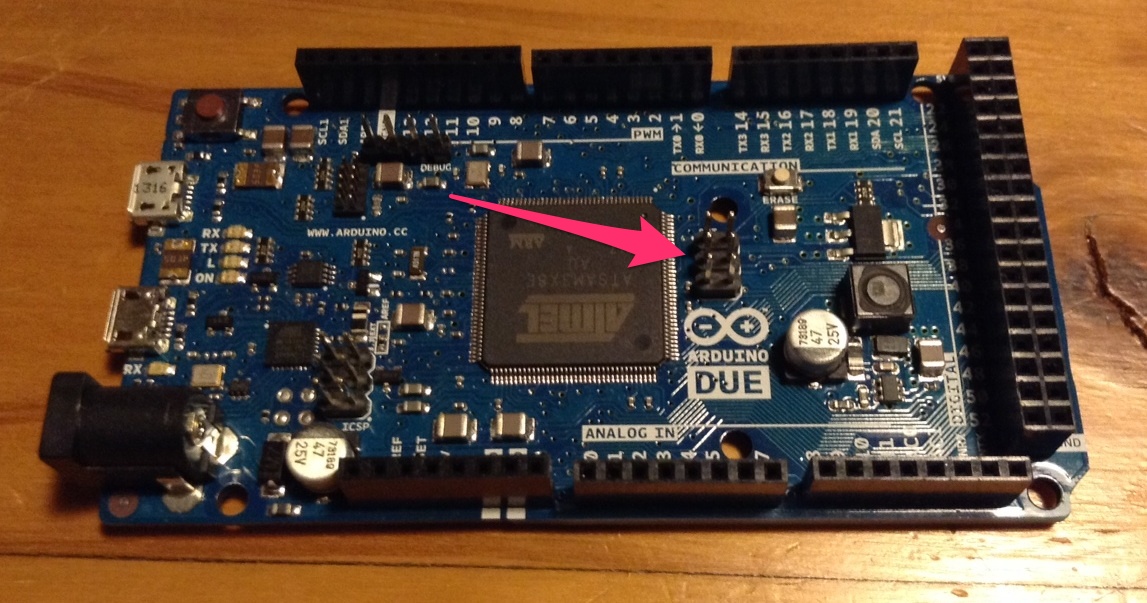
SPI available on the ICSP header, only.

To use SPI on the Due I need to somehow route the ISCP connector to pins 11, 12 and 13.
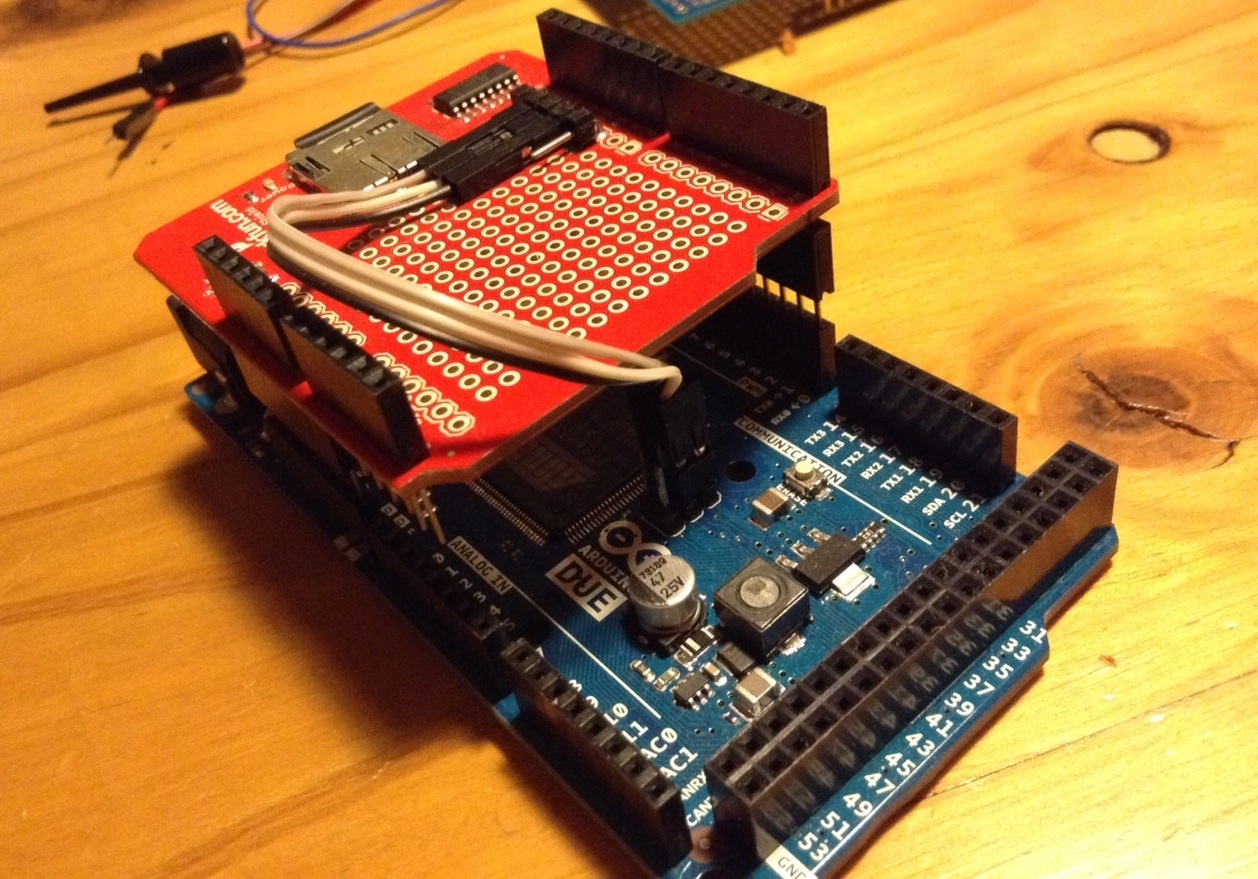
Nasty

Nasty.

The best solution I had at the time was to raise the shield away from the Due using stacked headers, then route the ISCP signals to the pins that the board (and the SDFat software) expected to find them with some jumper cables. Out of shot, pins 11, 12 and 13 were bent upwards so they did not make contact with the sockets on the Due board.

This was where the project stalled for a few months.

Recently I’ve had some time to come back to this project, and the first order of business was solving the SPI problem. It was clear that pins 11, 12 and 13 were the rightful place for the SPI signals and to try to route them anywhere else would be fruitless. So, with an official Arduino expansion shield in hand, I made myself an SPI adapter board.

ICSP adapter

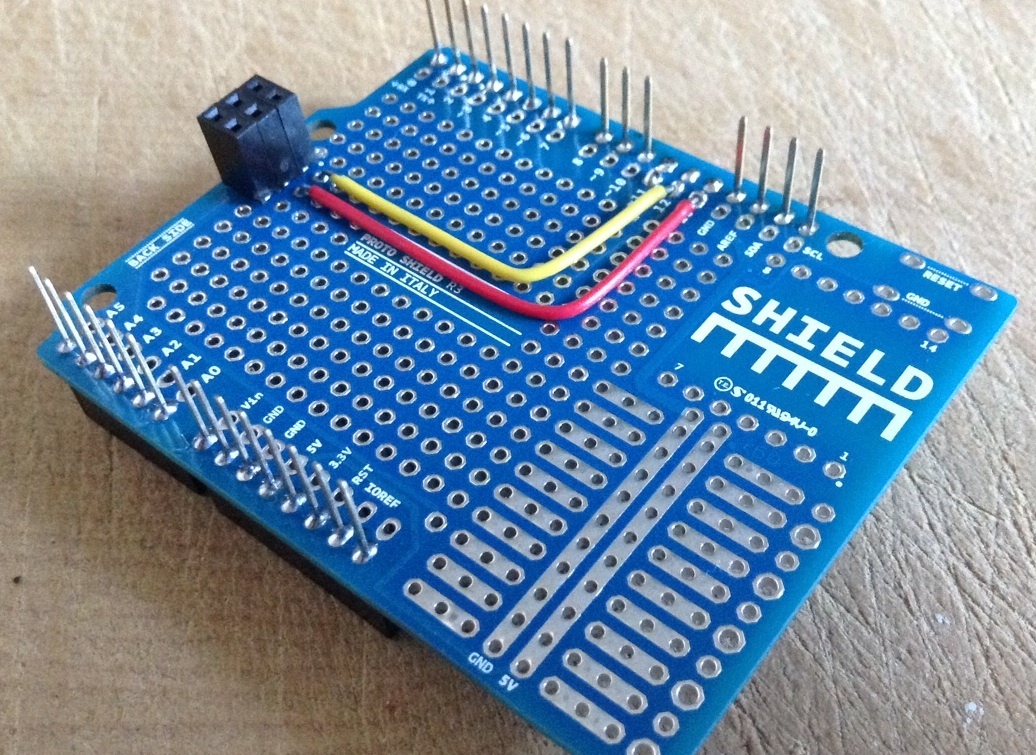
Pins 11, 12 and 13 are removed, but still connect to the stacked header on the opposite side of the board.

The board is very simple, all the usual Arduino Uno pins are passed through as expected, however pins 11, 12 and 13 are routed to the ICSP header to match the Arduino documentation.

icsp top view

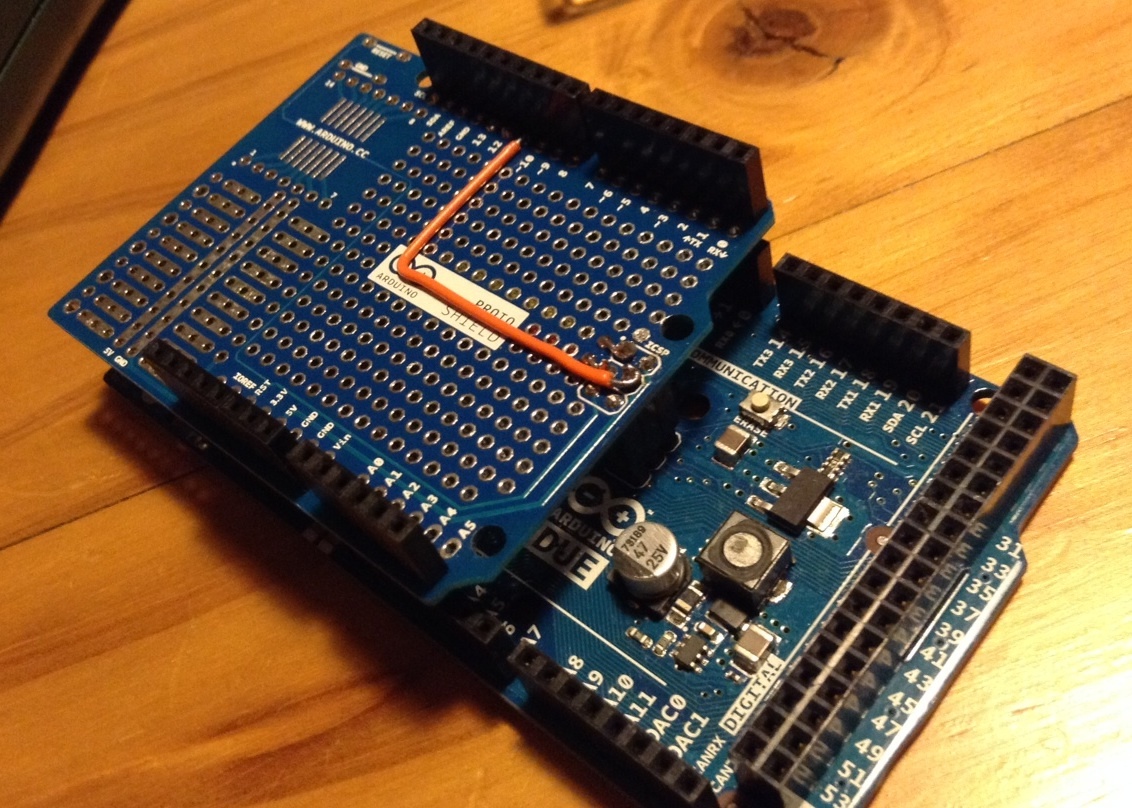
Adapter board mounted on an Arduino Due.

Here is a picture of the shield mounted on the Due. The trace for pin 11 is run on this side of the board to avoid crossing pin 13. I felt this was important as SPI can run upwards of 16 Mhz, however I’m not sure how much improvement this will make as these traces are still long and unshielded.

final

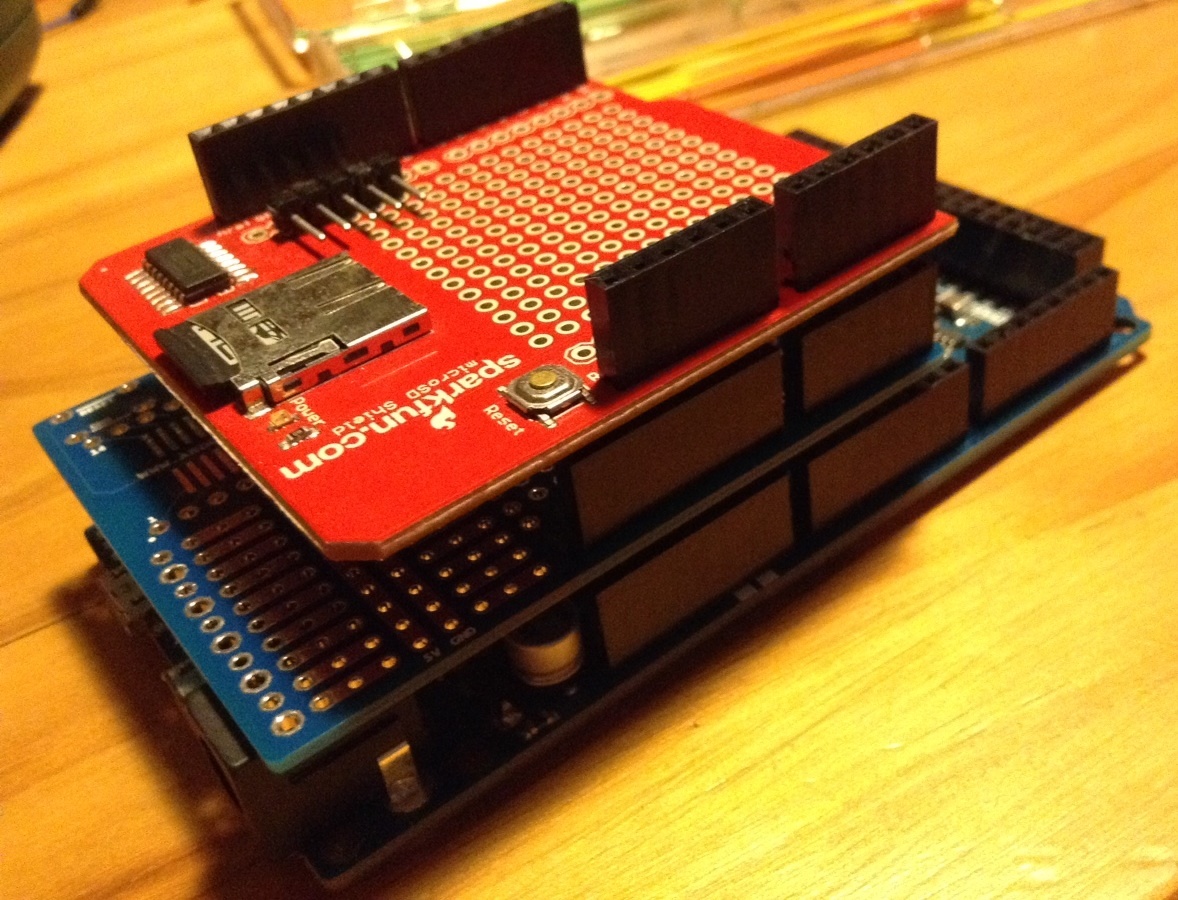
The final result, more compact and much more stable.

Here is a shot of result. The SD shield is mounted without floating pins or jumper wires and additional shields can be mounted on top of the SD card shield with the original locations of the SPI pins respected.

Visualising the Go garbage collector

Update this post is also available in Japanese.

This is a post about an experimental tool that I have been working on.

gcvis is a simple way of visualising the operation of the garbage collector within a Go process. Here is a screenshot of it in operation.
gcvis
The rest of this article explores how gcvis works and how to interpret its results.

How does gcvis get the data ?

There are a few ways you can interrogate a Go program.

You could use the built in profiler, via the net/http/pprof package, or my profile package. However this means modifying the source of the program, which sometimes may not be an option.

There is another source of telemetry data built into every Go program which is accessible by setting the following environment variable.

GODEBUG=gctrace=1

(The GODEBUG environment variable is documented in the runtime package).

When your program is started with this environment variable set, the following additional output will be printed to standard out (slightly abridged)

 % env GODEBUG=gctrace=1 godoc -http=:6060
...
gc76(1): 2+1+1390+1 us, 1 -> 3 MB, 16397 (1015746-999349) objects, 1436/1/0 sweeps, 0(0) handoff, 0(0) steal, 0/0/0 yields
gc77(1): 2+0+1582+1 us, 2 -> 4 MB, 14623 (1016248-1001625) objects, 1436/0/0 sweeps, 0(0) handoff, 0(0) steal, 0/0/0 yields
scvg0: inuse: 6, idle: 15, sys: 22, released: 0, consumed: 22 (MB)
scvg1: inuse: 6, idle: 15, sys: 22, released: 0, consumed: 22 (MB)
gc78(1): 5+1+4814+1 us, 2 -> 2 MB, 21076 (1023168-1002092) objects, 1436/25/0 sweeps, 0(0) handoff, 0(0) steal, 0/0/0 yields
scvg2: GC forced
scvg2: inuse: 6, idle: 15, sys: 22, released: 0, consumed: 22 (MB)

The two types of information presented are

  • A line for every garbage collection cycle, indicated by the gc prefix.
  • A set of lines for the operation of the scavenger, indicated by the scvg prefix, which is responsible for returning unused portions of the heap to the operating system.

In the next section I will discuss using, and interpreting the data from, gcvis.

Using gcvis

To use gcvis, place it in front of the Go program you want to inspect, as you would time or nice.

Here is an example of using gcvis with godoc in indexing mode (so it uses lots of memory and cpu time, generating interesting data).

% gcvis godoc -index -http=:6060
2014/07/11 16:29:12 opening browser window, if this fails, navigate to http://127.0.0.1:53267/
Created new window in existing browser session.

That’s it.

gcvis takes care of setting the appropriate value of GODEBUG and filtering out the additional information generated. gcvis also tries to open a browser window to view the visualisation. This functionality is provided by pkg/browser and is somewhat operating system dependent.

Because gcvis is recording the gc debug lines in real time, it can add timestamp information to them, a feature which is currently missing from that raw GODEBUG output.

Screenshot from 2014-07-11 16:35:09
In this example you can see the frequency of gc cycles decrease as the heap grows.

The main use of the gc debug data is to record the size of the live objects on the heap, however this doesn’t reveal the total size of the heap, nor what percentage of the heap the live set represents. For that we need to add the debugging information from the scavenger.

The scavenger runs on a timer, currently every two minutes, so will only start to report its data to gcviz a few minutes after the program starts. Here is an example after running for about 15 minutes.

Screenshot from 2014-07-11 17:01:31
Some interesting points to note in this graph are

  • scvg.sys represents the total amount of memory requested from the operating system, this is roughly analogous to the VSS value reported by tools like top.
  • scvg.inuse is the amount of memory in use by the whole heap, which may include dead objects. scvg.inuse and gc.heapinuse may not track each other exactly as they are reported at different times.
  • scvg.idle represents memory that is currently unused by the garbage collector, that is, used to contain dead objects, but is now unused after garbage collection.
  • When the scavenger runs, scvg.idle grows as scvg.inuse shrinks.
  • If memory remains idle for long enough the scavenger will inform the operating system that it is no longer needed, this is reported by scvg.released and matches a drop in scvg.consumedThe operating system is free to ignore this request, and frequently does.

Conclusion

The code is open source on Github, so go get it and try it on your application.

go get -u -v github.com/davecheney/gcvis

I’m very keen to hear from other Go users if gcvis is useful for you. Pull requests and bug reports are also most welcome.

A special thanks to Damian Gryski, Matthew Holt, and Bill Kennedy, for their suggestions and feedback.