Tag Archives: gc

The office coffee model of concurrent garbage collection

Garbage collection is a field with its own terminology. Concepts like like mutators, card marking, and write barriers create a hurdle to understanding how garbage collectors work. Here’s an analogy to explain the operations of a concurrent garbage collector using everyday items found in the workplace.

Before we discuss the operation of concurrent garbage collection, let’s introduce the dramatis personae. In offices around the world you’ll find one of these:

In the workplace coffee is a natural resource. Employees visit the break room and fill their cups as required. That is, until the point someone goes to fill their cup only to discover the pot is empty!

Immediately the office is thrown into chaos. Meeting are called. Investigations are held. The perpetrator who took the last cup without refilling the machine is found and reprimanded. Despite many passive aggressive notes the situation keeps happening, thus a committee is formed to decide if a larger coffee pot should be requisitioned. Once the coffee maker is again full office productivity slowly returns to normal.

This is the model of stop the world garbage collection. The various parts of your program proceed through their day consuming memory, or in our analogy coffee, without a care about the next allocation that needs to be made. Eventually one unlucky attempt to allocate memory is made only to find the heap, or the coffee pot, exhausted, triggering a stop the world garbage collection.


Down the road at a more enlightened workplace, management have adopted a different strategy for mitigating their break room’s coffee problems. Their policy is simple: if the pot is more than half full, fill your cup and be on your way. However, if the pot is less than half full, before filling your cup, you must add a little coffee and a little water to the top of the machine. In this way, by the time the next person arrives for their re-up, the level in the pot will hopefully have risen higher than when the first person found it.

This policy does come at a cost to office productivity. Rather than filling their cup and hoping for the best, each worker may, depending on the aggregate level of consumption in the office, have to spend a little time refilling the percolator and topping up the water. However, this is time spent by a person who was already heading to the break room. It costs a few extra minutes to maintain the coffee machine, but does not impact their officemates who aren’t in need of caffeination. If several people take a break at the same time, they will all find the level in the pot below the half way mark and all proceed to top up the coffee maker–the more consumption, the greater the rate the machine will be refilled, although this takes a little longer as the break room becomes congested.

This is the model of concurrent garbage collection as practiced by the Go runtime (and probably other language runtimes with concurrent collectors). Rather than each heap allocation proceeding blindly until the heap is exhausted, leading to a long stop the world pause, concurrent collection algorithms spread the work of walking the heap to find memory which is no longer reachable over the parts of the program allocating memory. In this way the parts of the program which allocate memory each pay a small cost–in terms of latency–for those allocations rather than the whole program being forced to halt when the heap is exhausted.

Lastly, in keeping with the office coffee model, if the rate of coffee consumption in the office is so high that management discovers that their staff are always in the break room trying desperately to refill the coffee machine, it’s time to invest in a machine with a bigger pot–or in garbage collection terms, grow the heap.
Visualising the Go garbage collector

Update this post is also available in Japanese.

This is a post about an experimental tool that I have been working on.

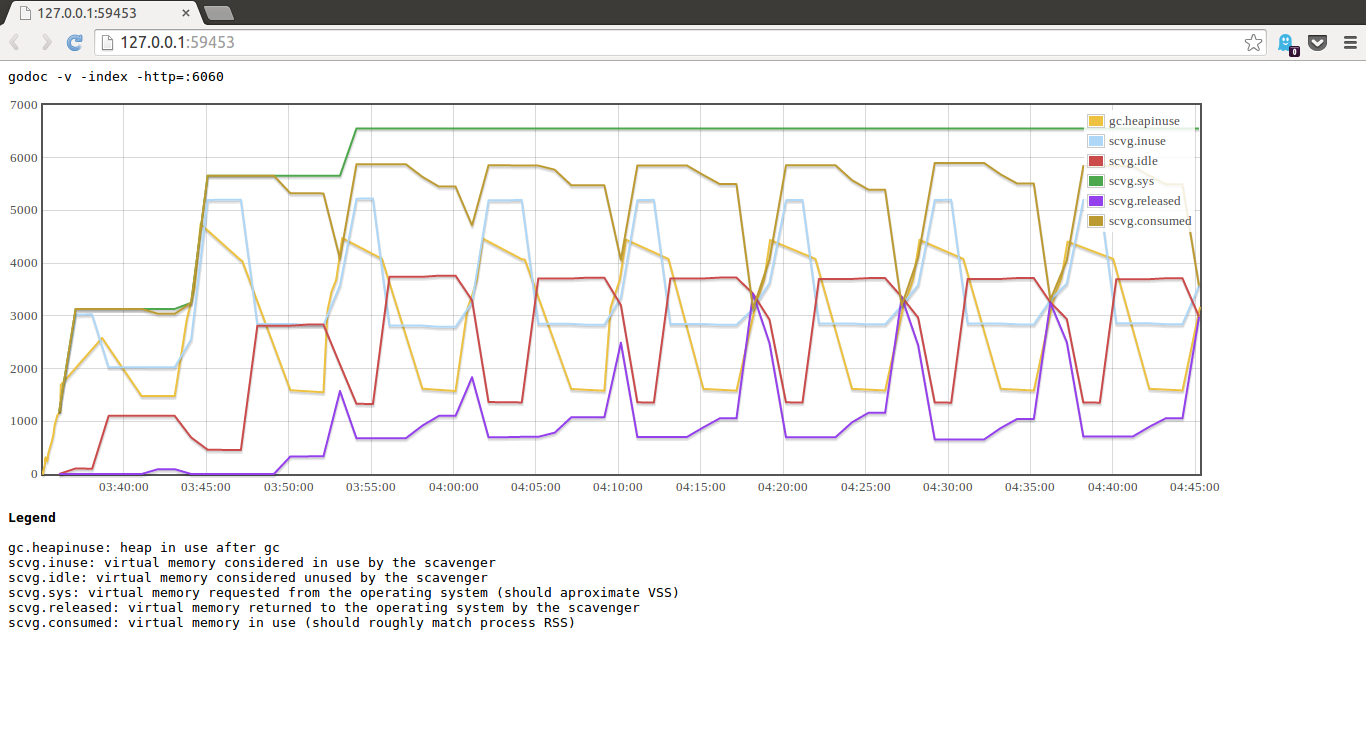
gcvis is a simple way of visualising the operation of the garbage collector within a Go process. Here is a screenshot of it in operation.
gcvis
The rest of this article explores how gcvis works and how to interpret its results.

How does gcvis get the data ?

There are a few ways you can interrogate a Go program.

You could use the built in profiler, via the net/http/pprof package, or my profile package. However this means modifying the source of the program, which sometimes may not be an option.

There is another source of telemetry data built into every Go program which is accessible by setting the following environment variable.

GODEBUG=gctrace=1

(The GODEBUG environment variable is documented in the runtime package).

When your program is started with this environment variable set, the following additional output will be printed to standard out (slightly abridged)

 % env GODEBUG=gctrace=1 godoc -http=:6060
...
gc76(1): 2+1+1390+1 us, 1 -> 3 MB, 16397 (1015746-999349) objects, 1436/1/0 sweeps, 0(0) handoff, 0(0) steal, 0/0/0 yields
gc77(1): 2+0+1582+1 us, 2 -> 4 MB, 14623 (1016248-1001625) objects, 1436/0/0 sweeps, 0(0) handoff, 0(0) steal, 0/0/0 yields
scvg0: inuse: 6, idle: 15, sys: 22, released: 0, consumed: 22 (MB)
scvg1: inuse: 6, idle: 15, sys: 22, released: 0, consumed: 22 (MB)
gc78(1): 5+1+4814+1 us, 2 -> 2 MB, 21076 (1023168-1002092) objects, 1436/25/0 sweeps, 0(0) handoff, 0(0) steal, 0/0/0 yields
scvg2: GC forced
scvg2: inuse: 6, idle: 15, sys: 22, released: 0, consumed: 22 (MB)

The two types of information presented are

  • A line for every garbage collection cycle, indicated by the gc prefix.
  • A set of lines for the operation of the scavenger, indicated by the scvg prefix, which is responsible for returning unused portions of the heap to the operating system.

In the next section I will discuss using, and interpreting the data from, gcvis.

Using gcvis

To use gcvis, place it in front of the Go program you want to inspect, as you would time or nice.

Here is an example of using gcvis with godoc in indexing mode (so it uses lots of memory and cpu time, generating interesting data).

% gcvis godoc -index -http=:6060
2014/07/11 16:29:12 opening browser window, if this fails, navigate to http://127.0.0.1:53267/
Created new window in existing browser session.

That’s it.

gcvis takes care of setting the appropriate value of GODEBUG and filtering out the additional information generated. gcvis also tries to open a browser window to view the visualisation. This functionality is provided by pkg/browser and is somewhat operating system dependent.

Because gcvis is recording the gc debug lines in real time, it can add timestamp information to them, a feature which is currently missing from that raw GODEBUG output.

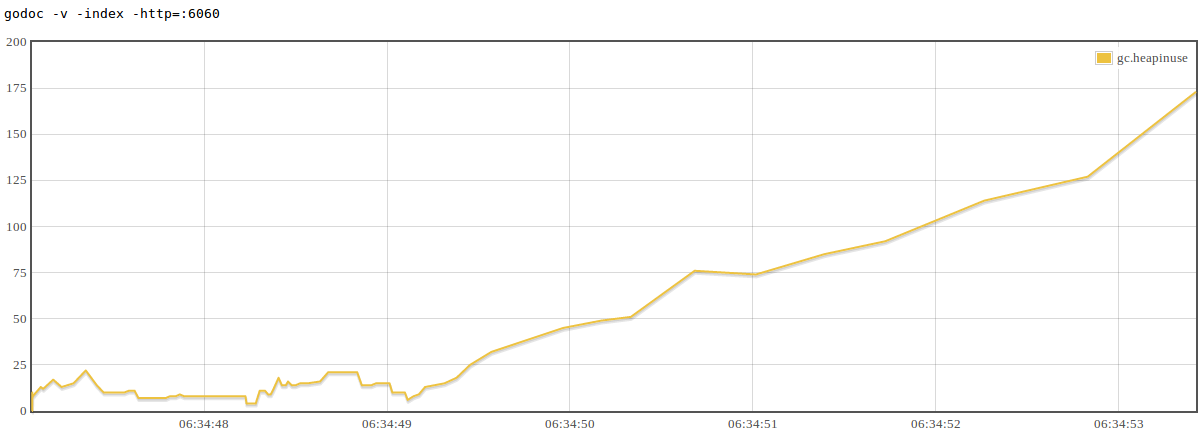
Screenshot from 2014-07-11 16:35:09
In this example you can see the frequency of gc cycles decrease as the heap grows.

The main use of the gc debug data is to record the size of the live objects on the heap, however this doesn’t reveal the total size of the heap, nor what percentage of the heap the live set represents. For that we need to add the debugging information from the scavenger.

The scavenger runs on a timer, currently every two minutes, so will only start to report its data to gcviz a few minutes after the program starts. Here is an example after running for about 15 minutes.

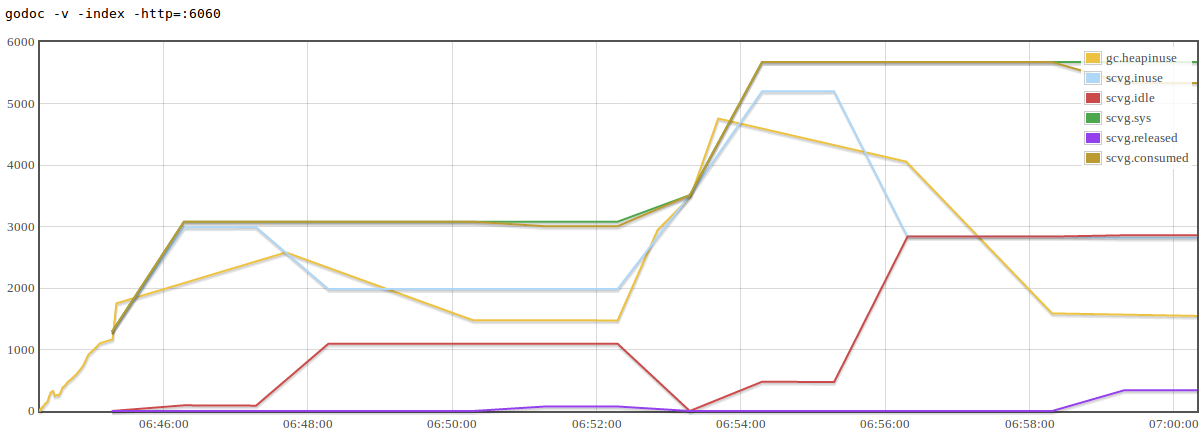
Screenshot from 2014-07-11 17:01:31
Some interesting points to note in this graph are

  • scvg.sys represents the total amount of memory requested from the operating system, this is roughly analogous to the VSS value reported by tools like top.
  • scvg.inuse is the amount of memory in use by the whole heap, which may include dead objects. scvg.inuse and gc.heapinuse may not track each other exactly as they are reported at different times.
  • scvg.idle represents memory that is currently unused by the garbage collector, that is, used to contain dead objects, but is now unused after garbage collection.
  • When the scavenger runs, scvg.idle grows as scvg.inuse shrinks.
  • If memory remains idle for long enough the scavenger will inform the operating system that it is no longer needed, this is reported by scvg.released and matches a drop in scvg.consumedThe operating system is free to ignore this request, and frequently does.

Conclusion

The code is open source on Github, so go get it and try it on your application.

go get -u -v github.com/davecheney/gcvis

I’m very keen to hear from other Go users if gcvis is useful for you. Pull requests and bug reports are also most welcome.

A special thanks to Damian Gryski, Matthew Holt, and Bill Kennedy, for their suggestions and feedback.