Category Archives: Go

Go has both make and new functions, what gives ?

This is a post about Go’s built in make and new functions.

As Rob Pike noted at Gophercon this year, Go has many ways of initialising variables. Among them is the ability to take the address of a struct literal which leads to serveral ways to do the same thing.

s := &SomeStruct{}
v := SomeStruct{}
s := &v              // identical
s := new(SomeStruct) // also identical

It is fair that commenters point out this redundancy in the language and this sometimes leads them to search for other inconsistencies, most notably the redundancy between make and new.

On the surface it appears that make and new do very similar things, so what is the rationale for having both ?

Why can’t we use make for everything ?

Go does not have user defined generic types, but it does have several built in types that can operate as generic lists, maps, sets, and queues;  slices, maps and channels.

Because make is designed to create these three built in generic types, it must be provided by the runtime as there is no way to express the function signature of make directly in Go.

Although make creates generic slice, map, and channel values, they are still just regular values; make does not return pointer values.

If new was removed in favour make, how would you construct a pointer to an initialised value ?

var x1 *int
var x2 = new(int)

x1 and x2 have the same type, *intx2 points to initialised memory and may be safely dereferenced, the same is not true for x1.

Why can’t we use new for everything ?

Although the use of new is rare, its behaviour is well specified.

new(T) always returns a *T pointing to an initialised T. As Go doesn’t have constructors, the value will be initialised to T‘s zero value.

Using new to construct a pointer to a slice, map, or channel zero value works today and is consistent with the behaviour of new.

s := new([]string)
fmt.Println(len(*s))  // 0
fmt.Println(*s == nil) // true

m := new(map[string]int)
fmt.Println(m == nil) // false
fmt.Println(*m == nil) // true

c := new(chan int)
fmt.Println(c == nil) // false
fmt.Println(*c == nil) // true

Sure, but these are just rules, we can change them, right ?

For the confusion they may cause, make and new are consistent; make only makes slices, maps, and channels, new only returns pointers to initialised memory.

Yes, new could be extended to operate like make for slices, maps and channels, but that would introduce its own inconsistencies.

  1. new would have special behaviour if the type passed to new was a slice, map or channel. This is a rule that every Go programmer would have to remember.
  2. For slices and channels, new would have to become variadic, taking a possible length, buffer size, or capacity, as required. Again more special cases to have to remember, whereas before new took exactly one argument, the type.
  3. new always returns a *T for the T passed to it. That would mean code like
    func Read(buf []byte) []byte
    // assume new takes an optional length
    buf := Read(new([]byte, 4096))

    would no longer be possible, requiring more special cases in the grammar to permit *new([]byte, length).

In summary

make and new do different things.

If you are coming from another language, especially one that uses constructors, it may appear that new should be all you need, but Go is not those languages, nor does it have constructors.

My advice is to use new sparingly, there are almost always easier or cleaner ways to write your program without it.

As a code reviewer, the use of new, like the use of named return arguments, is a signal that the code is trying to do something clever and I need to pay special attention. It may be that code really is clever, but more than likely, it can be rewritten to be clearer and more idiomatic.

Tinyterm: A silly terminal emulator written in Go

Tinyterm
This post is about Tinyterm, a silly hack that I presented as a lightning talk at last month’s Sydney Go User group 1. You can find the original slides online at talks.golang.org.


Screenshot from 2014-08-03 14:22:43

This talk is about a experiment to see if I could drive I2C devices from Go through my laptop’s VGA port. It was inspired by a recent post on Hack-a-Day.

Screenshot from 2014-08-03 14:23:26

There are several parts to this presentation. There is some Go in here, trusty me.

Screenshot from 2014-08-03 14:24:03

The first piece of the puzzle is the I2C bus.

The I2C bus is a low speed two wire serial bus mainly used for connecting sensors and microcontrollers together.

But, you don’t even need a microcontroller to use I2C. If you’re patient you can bit bang the protocol using a few resistors and tack switches.

Screenshot from 2014-08-03 14:24:42

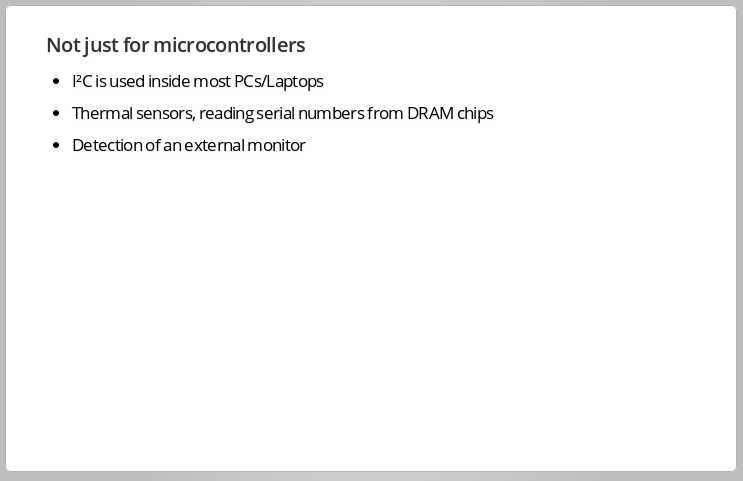
I2C isn’t just used on microcontrollers like the Arduino. It’s has been used inside every PC and laptop for decades as a slow speed serial protocol for interfacing with simple devices like temperature sensors.

If you’ve used the lmsensors package in Linux, or have heard of SMBus, this is basically a variant of I2C.

Importantly, I2C is also used as the protocol to detect an external monitor, where it goes under the name DDC2b.

ddc

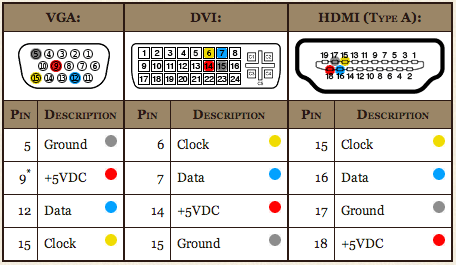
i2C pins are available on VGA, DVI and HDMI connectors. Source http://www.paintyourdragon.com/?p=43

Screenshot from 2014-08-03 13:37:06

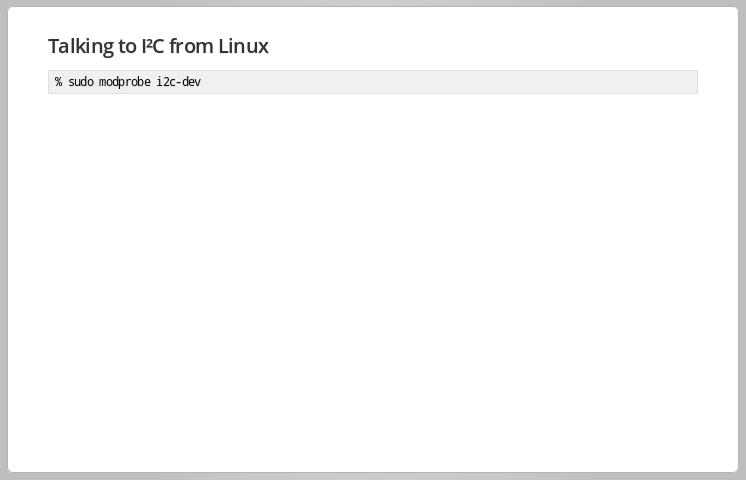
Talking to I2C devices is as simple as installing a kernel module which will create devices entries in your /dev/ directory.

% ls /dev/i2c*
/dev/i2c-0  /dev/i2c-1  /dev/i2c-2  /dev/i2c-3  /dev/i2c-4 
/dev/i2c-5  /dev/i2c-6  /dev/i2c-7  /dev/i2c-8

Screenshot from 2014-08-03 13:39:18

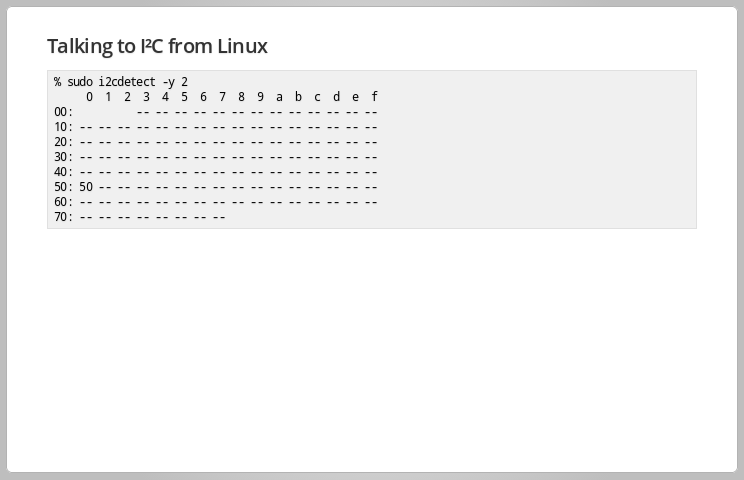
Each device on the I2C bus has a unique address. You can use the i2cdetect command (part of the i2c-utils package on Ubuntu) to scan the bus.

In this example, the device responding at 0x50 is my laptop’s internal LCD screen. That device is an EEPROM which holds specifications of the screen.

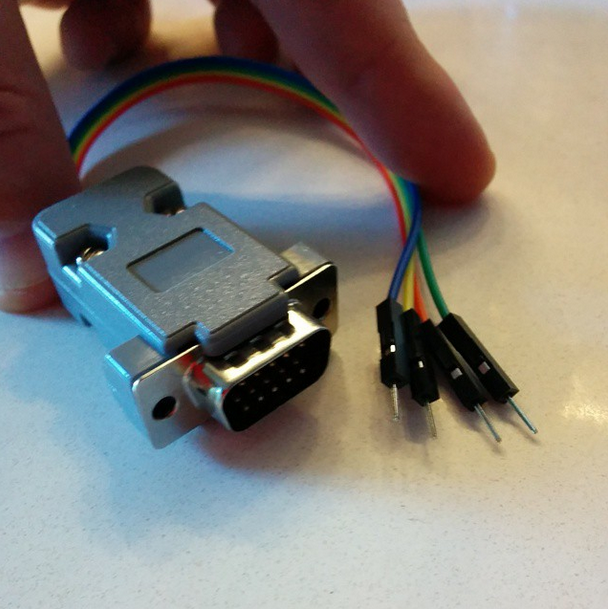
After a bit of reverse engineering of the hack a day post, and a quick trip to Jaycar for parts I came up with this simple adapter

i2c adapter mark I

I2C adapter mark I

The adapter just breaks out pins 5, 9, 12, and 15 to the Dupont patch cables. Using a logic analyser I verified that pins 12 and 15 looked like I2C data when I ran i2cdetect.

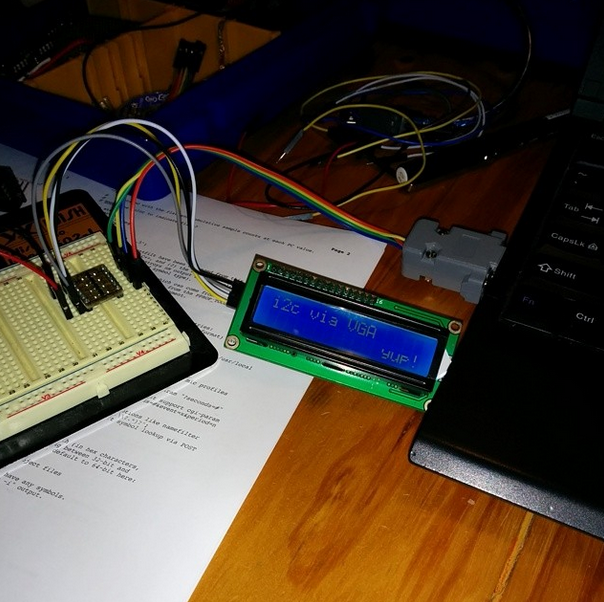
i2c adapter talking to an i2c io expander

I2C adapter talking to an I2C IO expander

The next step was to connect up a real I2C device to the bus and see if I could detect it with i2cdetect.

Although both the LCD and the laptop are 5 volt devices I wasn’t sure how much current the laptop could source on pin 9, so I opted to buffer the devices using a Freetronics level shifter which effectively isolates the laptop from the high current LED backlight on the LCD panel.

Screenshot from 2014-08-03 13:56:10

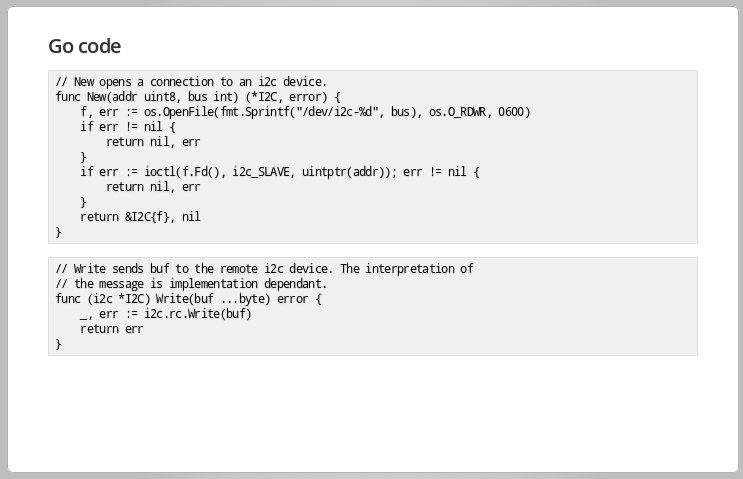
Now the hardware was done, it was time to write some code. Driving an I2C device from userspace in Go is pretty straight forward; open the device, then use an ioctl to tell the kernel to bind the file descriptor to a remote I2C device.

Screenshot from 2014-08-03 13:58:55

The LCD I was using is based on the Hitachi HD44780 standard which has a baroque protocol using many pins and is completely incompatible with I2C.

To interface between the HD44780 I’m using a cheap PCF8574 I2C IO expander which takes any byte received over I2C and maps it directly to its output pins.

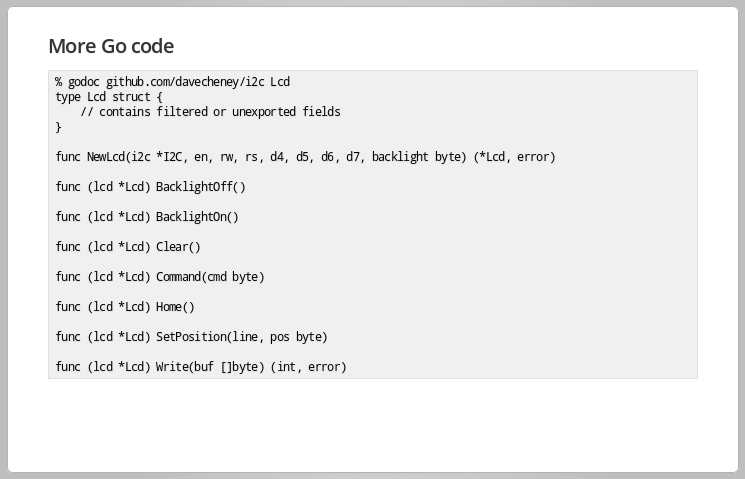
I adapted some Python code to work with my Go I2C type which gave me a set of LCD primitives to work with.

Screenshot from 2014-08-03 14:04:51

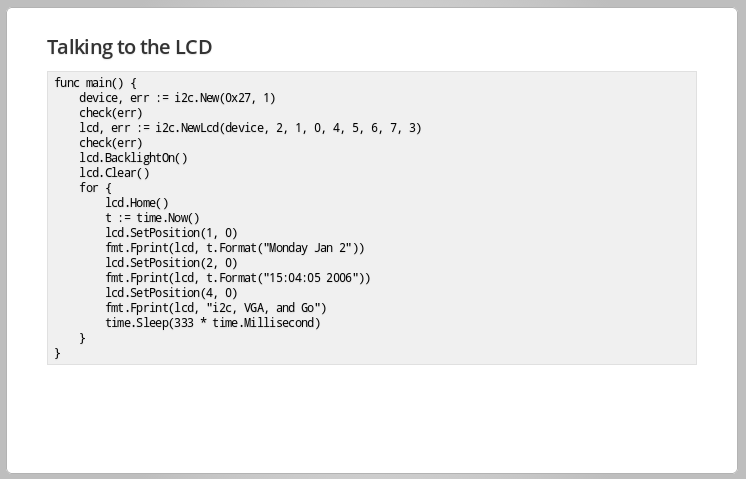
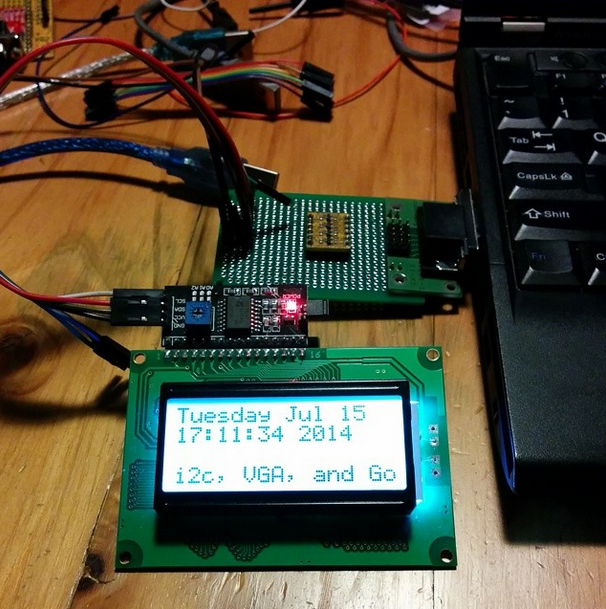
So now I can drive the output of the LCD with Go. Here is an example

helloworld.go

helloworld.go

Screenshot from 2014-08-03 14:07:20

But this was kind of boring, could I do something more interesting ?

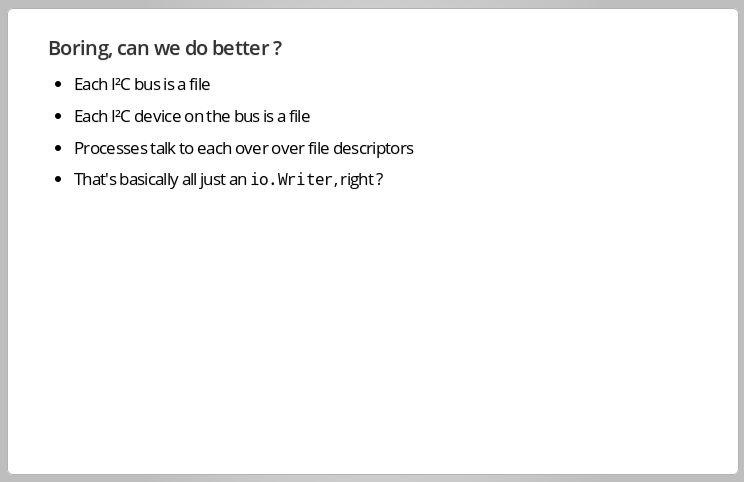
Looking back through this project it occurred to me that the recurring theme was, in the best UNIX tradition, everything is a file.

  • I2C buses are visible in userspace as files
  • Each I2C device is a file descriptor, once opened and programmed by ioctl
  • UNIX processes talk to each other over file descriptors
  • In Go, that is basically an io.Writer, right ?

So, could I connect a UNIX process’s output to the LCD screen transparently ?

Screenshot from 2014-08-03 14:11:28

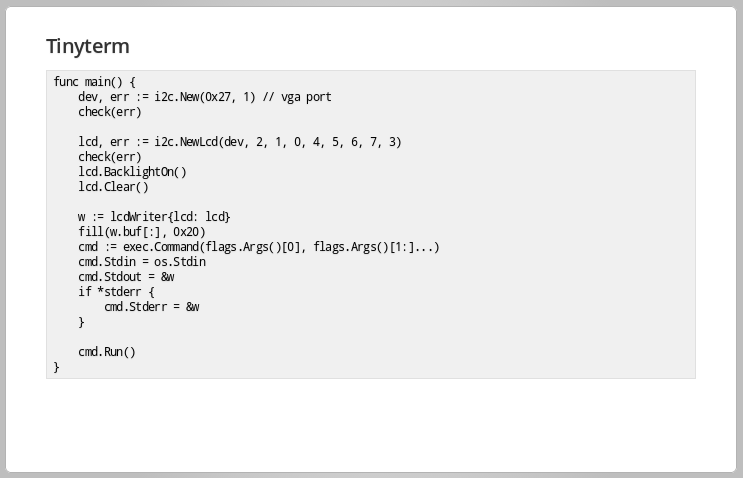
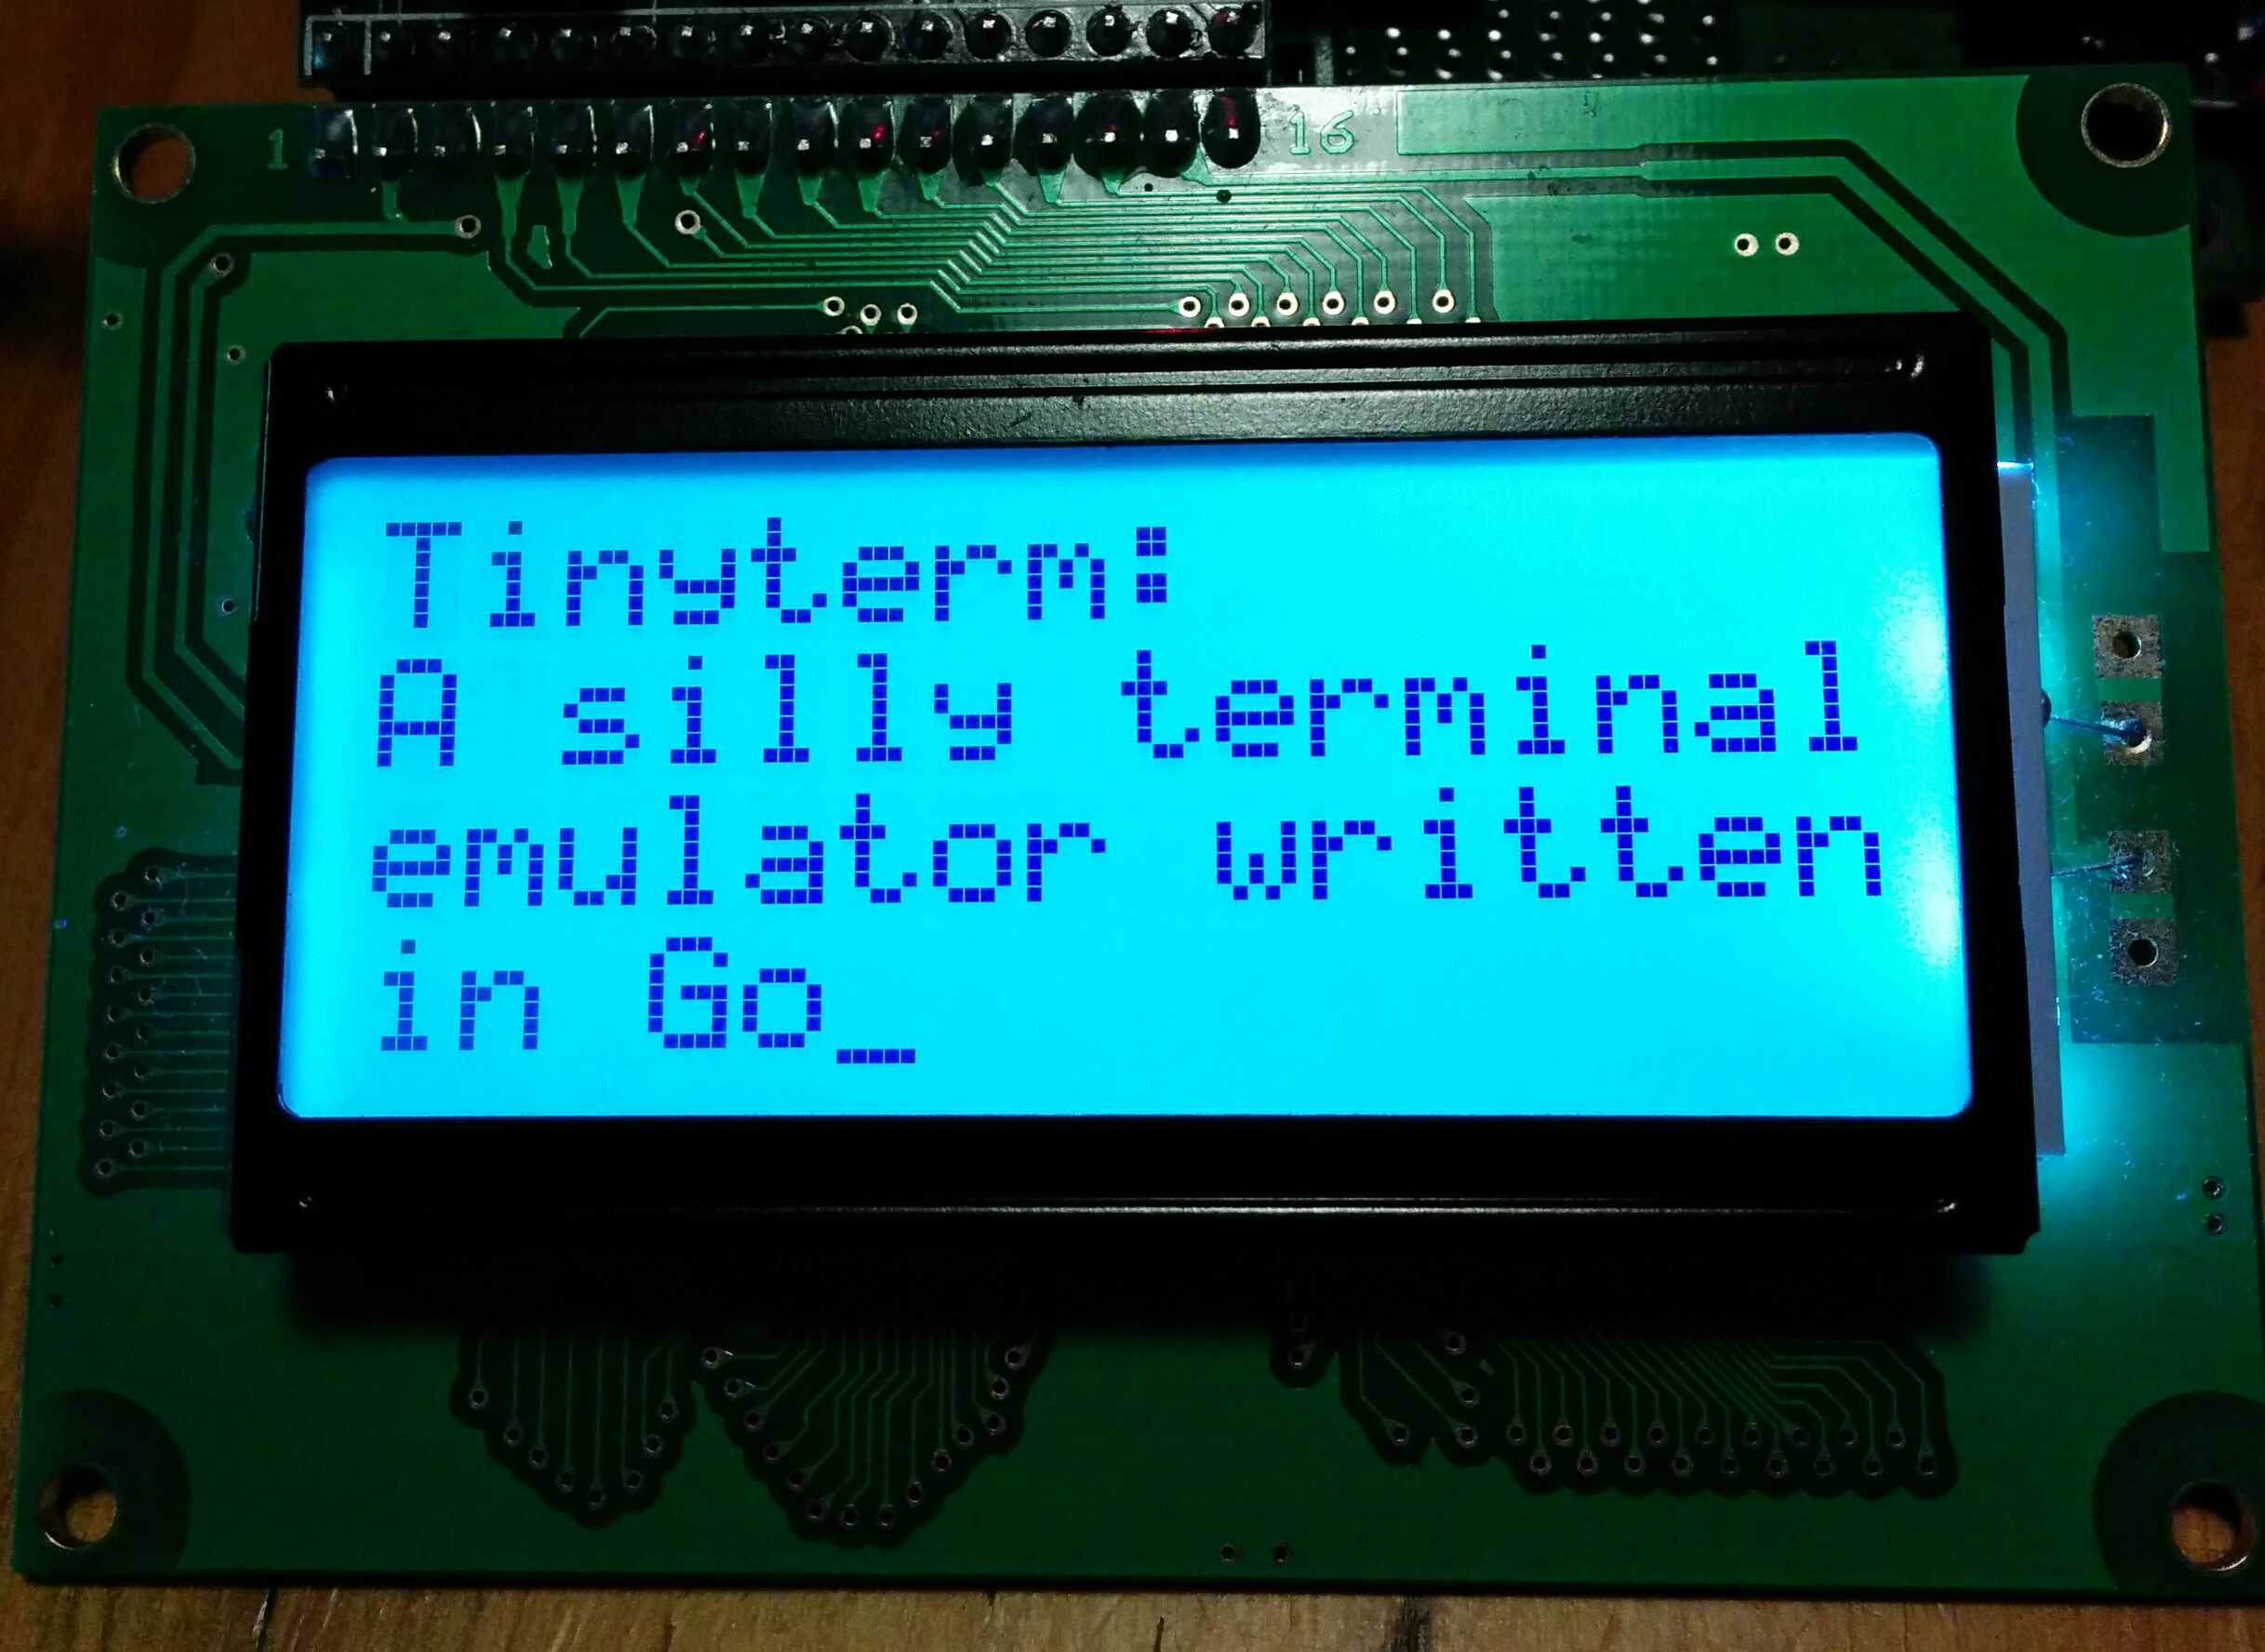
Enter Tinyterm, a simple Go program that does just that.

Using an lcdWriter type (more on that in the next slide), Tinyterm spawns a child process and redirects Stdout and Stderr to the LCD.

Screenshot from 2014-08-03 14:15:43

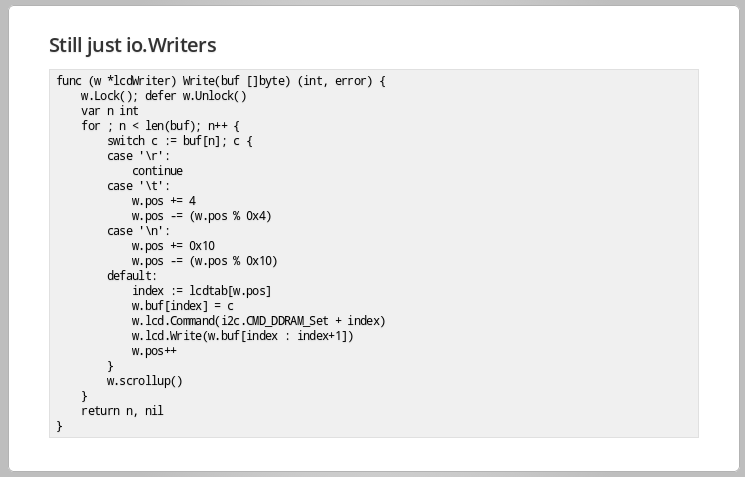
The lcdWriter‘s Write method has a little bit of smarts to deal with making the LCD look like a 16 x 4 terminal, rather than a linear stream of characters, handles scrolling the screen, and obscures the odd addressing scheme of the video memory inside the HD44780.

Screenshot from 2014-08-03 14:17:37

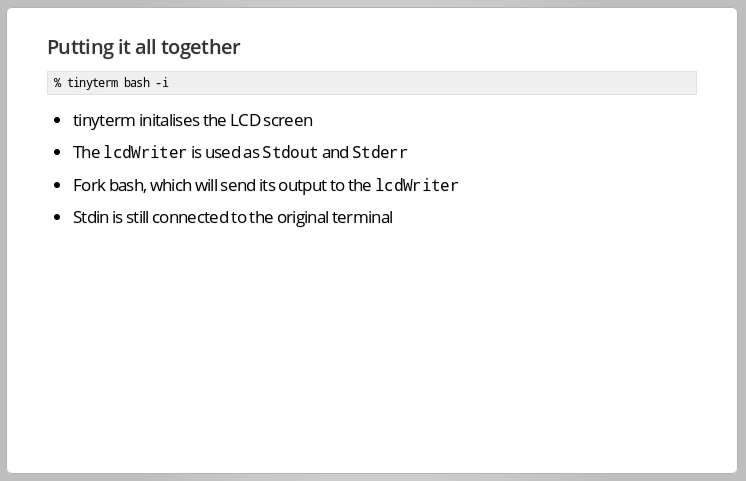
Putting it all together we have the tinyterm command, which runs its arguments as a subprocess, sending the child’s stdout and stderr to the LCD. Stdin is not redirected, so it takes input from the original terminal device, eventually mapping back to my keyboard.

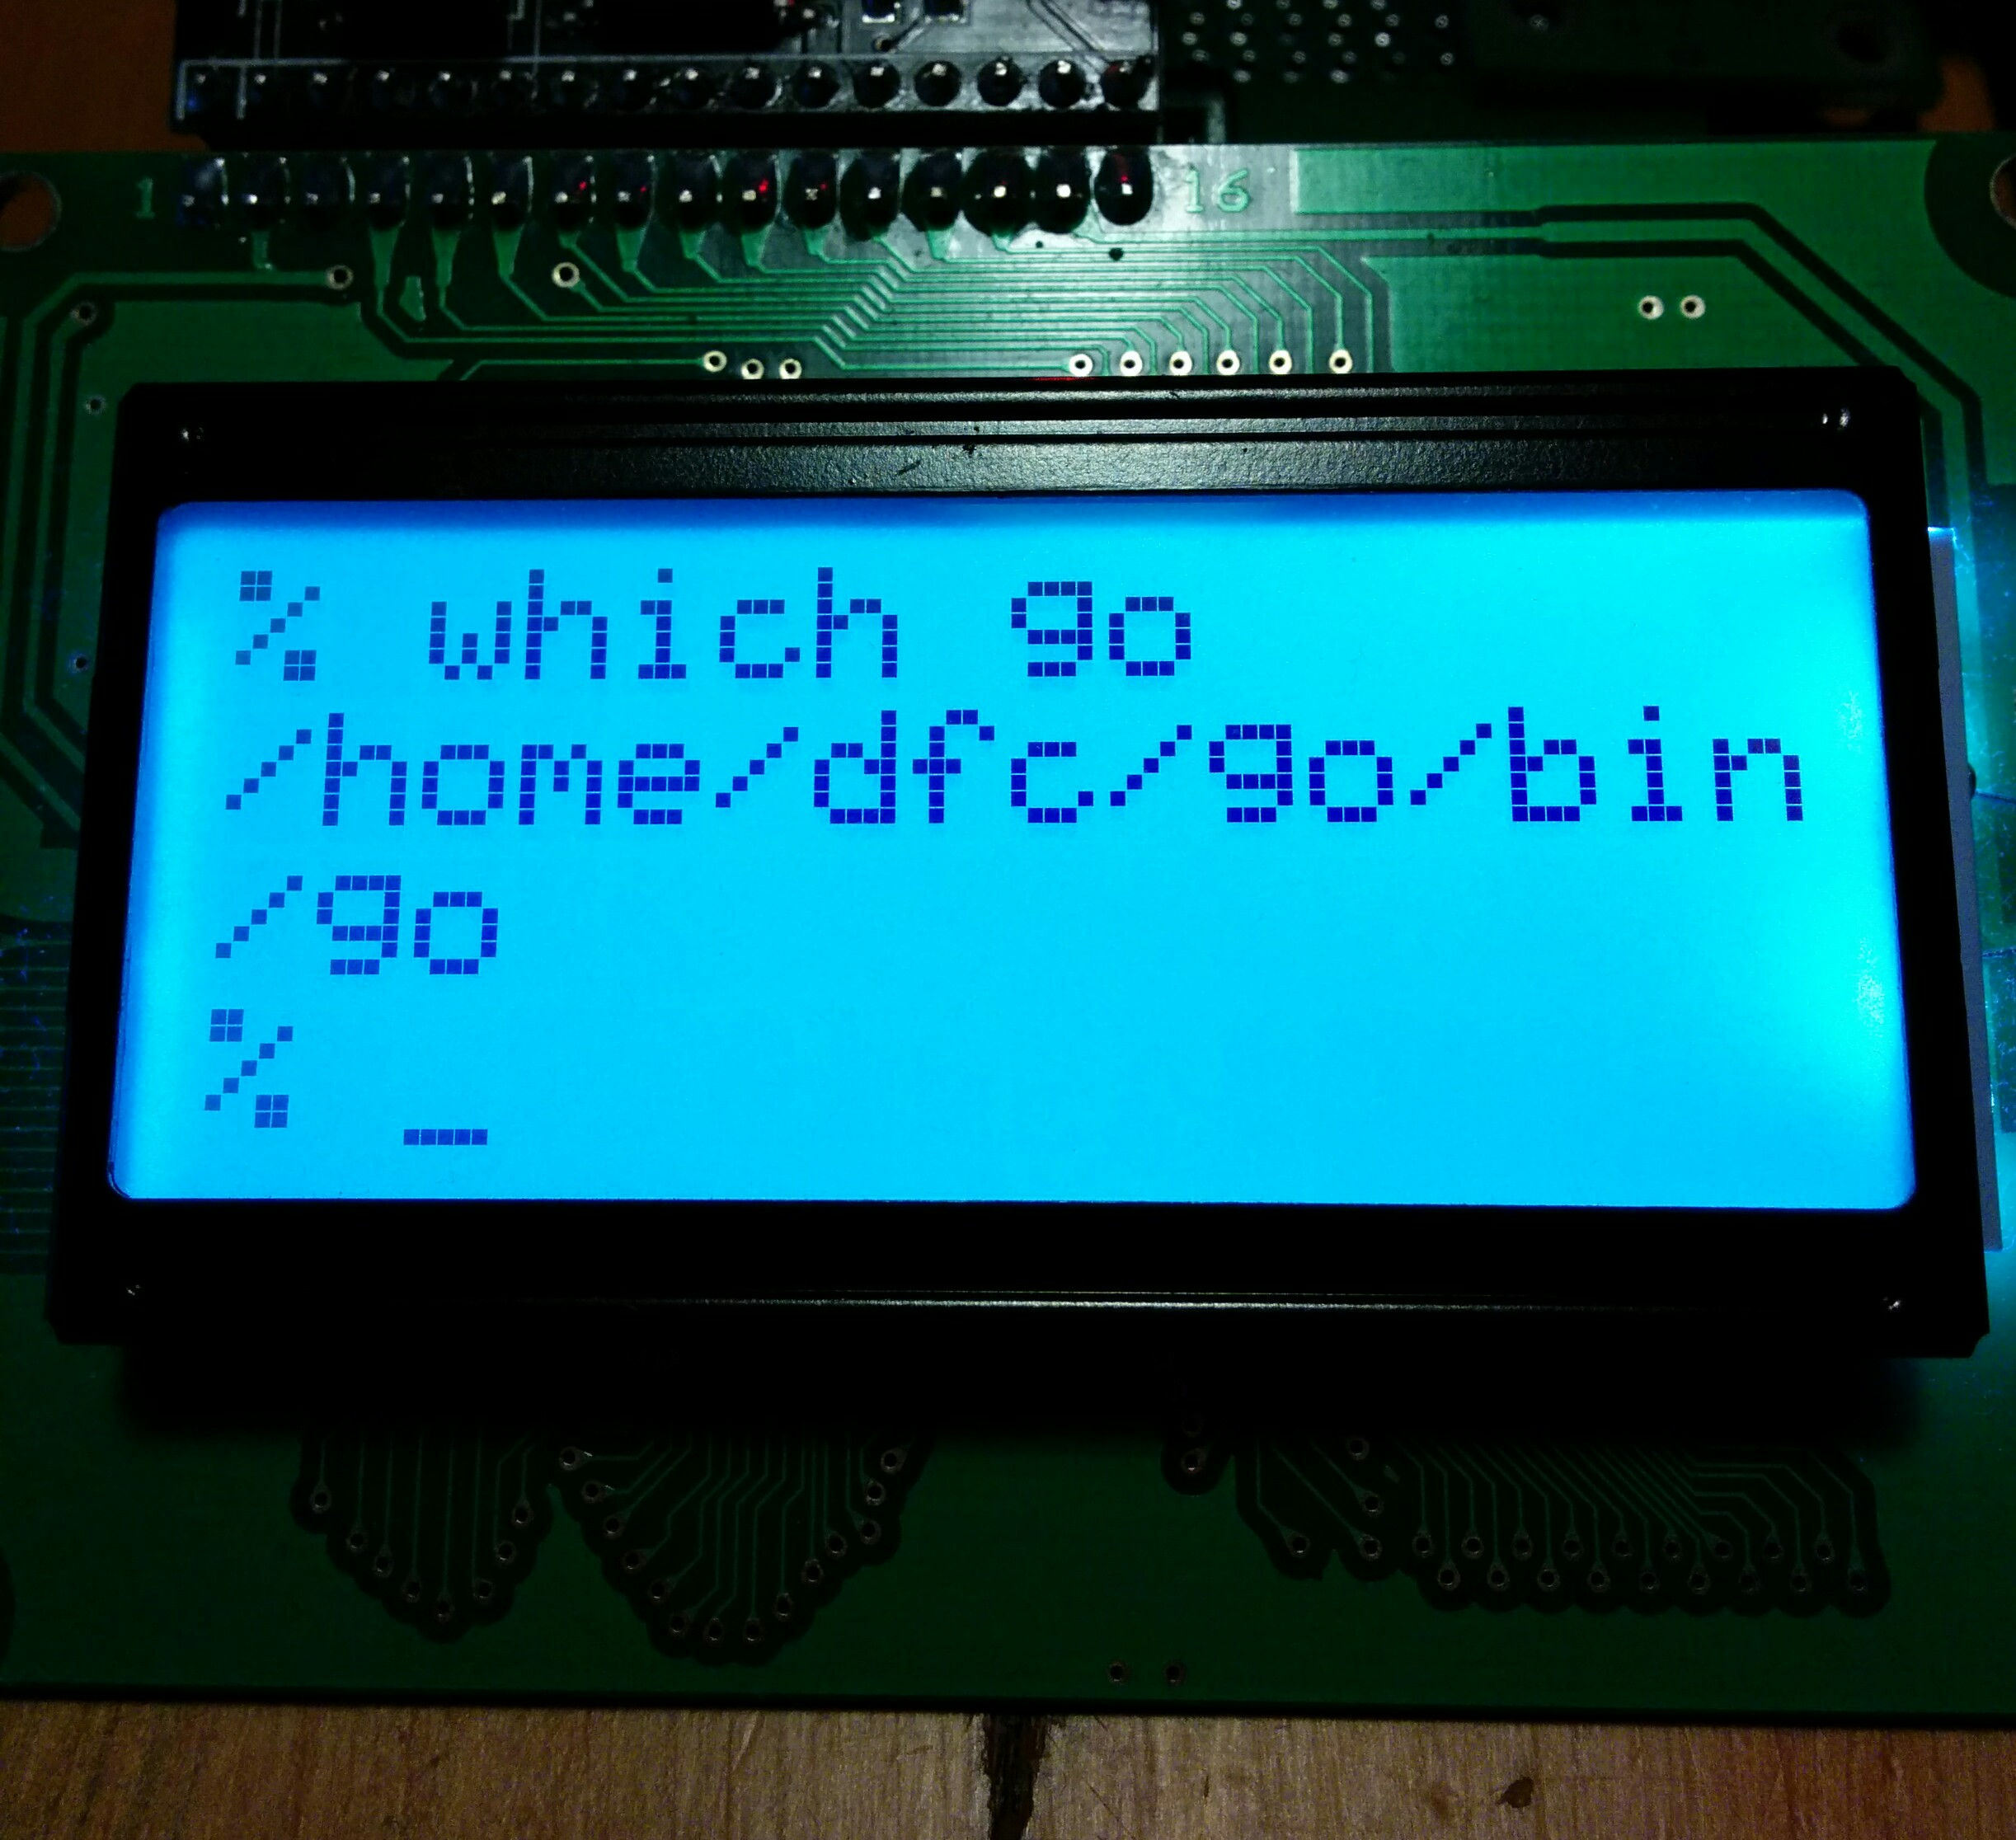
Tinyterm example, hopefully a video will be available soon.

Tinyterm example, hopefully a video will be available soon.

Screenshot from 2014-08-03 14:20:00

The code for the i2c and lcd types is on github, github.com/davecheney/i2c, along with the helloworld and tinyterm example programs.


1 The talk was recorded but it is not clear if the recording worked, I will update this post if/when the video is available.

Visualising the Go garbage collector

Update this post is also available in Japanese.

This is a post about an experimental tool that I have been working on.

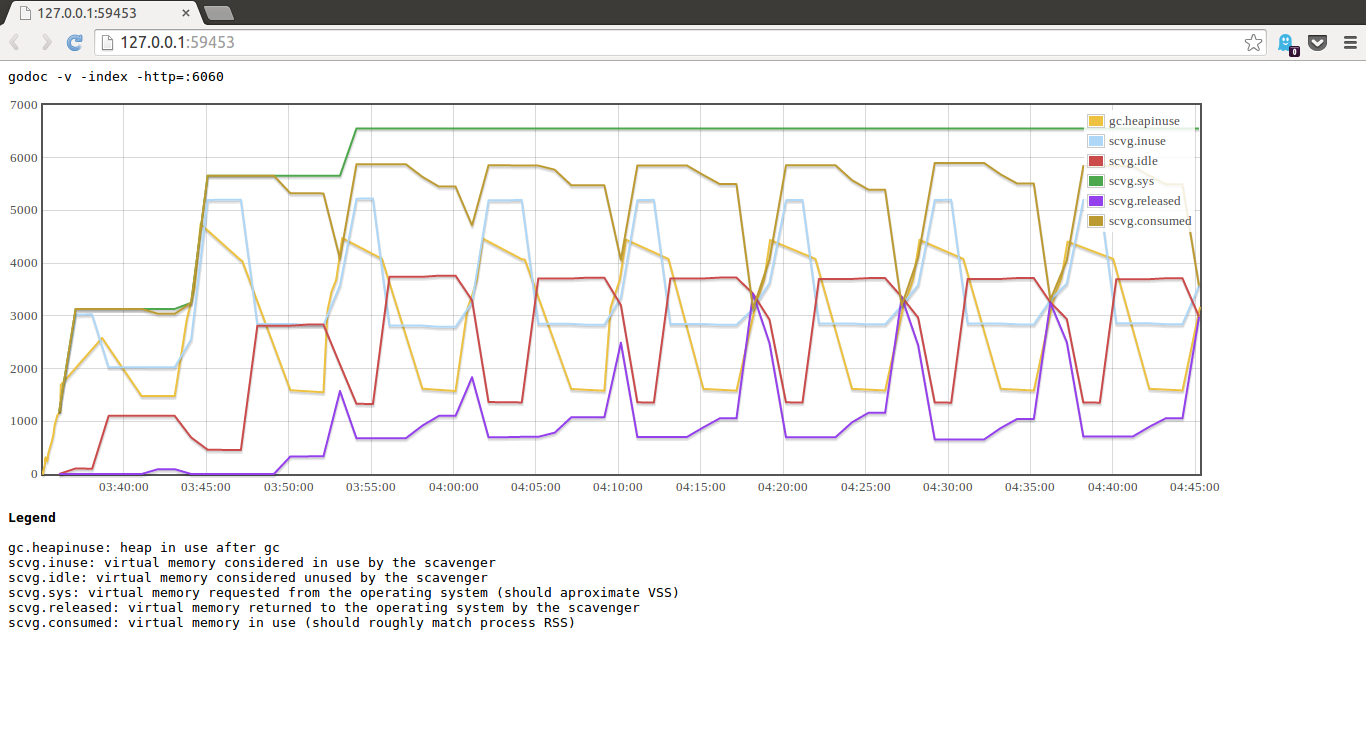
gcvis is a simple way of visualising the operation of the garbage collector within a Go process. Here is a screenshot of it in operation.
gcvis
The rest of this article explores how gcvis works and how to interpret its results.

How does gcvis get the data ?

There are a few ways you can interrogate a Go program.

You could use the built in profiler, via the net/http/pprof package, or my profile package. However this means modifying the source of the program, which sometimes may not be an option.

There is another source of telemetry data built into every Go program which is accessible by setting the following environment variable.

GODEBUG=gctrace=1

(The GODEBUG environment variable is documented in the runtime package).

When your program is started with this environment variable set, the following additional output will be printed to standard out (slightly abridged)

 % env GODEBUG=gctrace=1 godoc -http=:6060
...
gc76(1): 2+1+1390+1 us, 1 -> 3 MB, 16397 (1015746-999349) objects, 1436/1/0 sweeps, 0(0) handoff, 0(0) steal, 0/0/0 yields
gc77(1): 2+0+1582+1 us, 2 -> 4 MB, 14623 (1016248-1001625) objects, 1436/0/0 sweeps, 0(0) handoff, 0(0) steal, 0/0/0 yields
scvg0: inuse: 6, idle: 15, sys: 22, released: 0, consumed: 22 (MB)
scvg1: inuse: 6, idle: 15, sys: 22, released: 0, consumed: 22 (MB)
gc78(1): 5+1+4814+1 us, 2 -> 2 MB, 21076 (1023168-1002092) objects, 1436/25/0 sweeps, 0(0) handoff, 0(0) steal, 0/0/0 yields
scvg2: GC forced
scvg2: inuse: 6, idle: 15, sys: 22, released: 0, consumed: 22 (MB)

The two types of information presented are

  • A line for every garbage collection cycle, indicated by the gc prefix.
  • A set of lines for the operation of the scavenger, indicated by the scvg prefix, which is responsible for returning unused portions of the heap to the operating system.

In the next section I will discuss using, and interpreting the data from, gcvis.

Using gcvis

To use gcvis, place it in front of the Go program you want to inspect, as you would time or nice.

Here is an example of using gcvis with godoc in indexing mode (so it uses lots of memory and cpu time, generating interesting data).

% gcvis godoc -index -http=:6060
2014/07/11 16:29:12 opening browser window, if this fails, navigate to http://127.0.0.1:53267/
Created new window in existing browser session.

That’s it.

gcvis takes care of setting the appropriate value of GODEBUG and filtering out the additional information generated. gcvis also tries to open a browser window to view the visualisation. This functionality is provided by pkg/browser and is somewhat operating system dependent.

Because gcvis is recording the gc debug lines in real time, it can add timestamp information to them, a feature which is currently missing from that raw GODEBUG output.

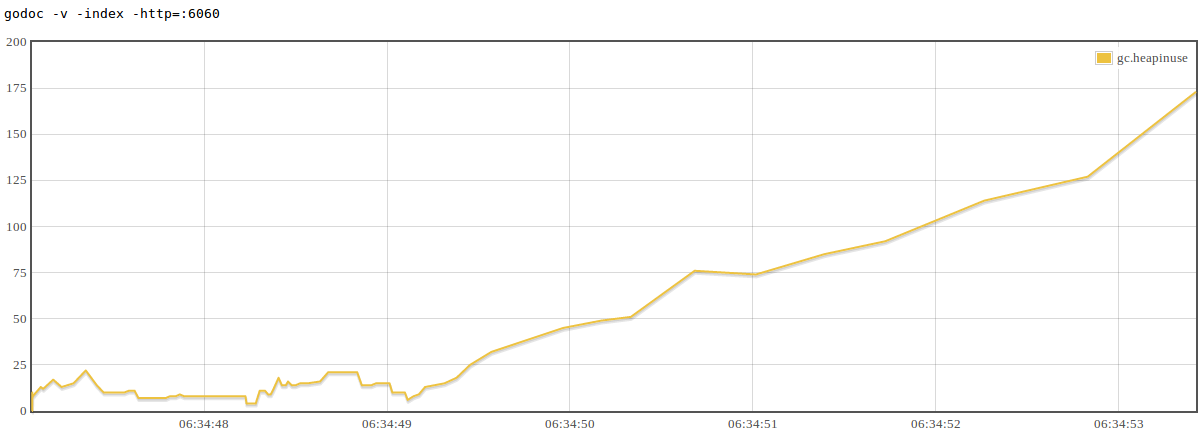
Screenshot from 2014-07-11 16:35:09
In this example you can see the frequency of gc cycles decrease as the heap grows.

The main use of the gc debug data is to record the size of the live objects on the heap, however this doesn’t reveal the total size of the heap, nor what percentage of the heap the live set represents. For that we need to add the debugging information from the scavenger.

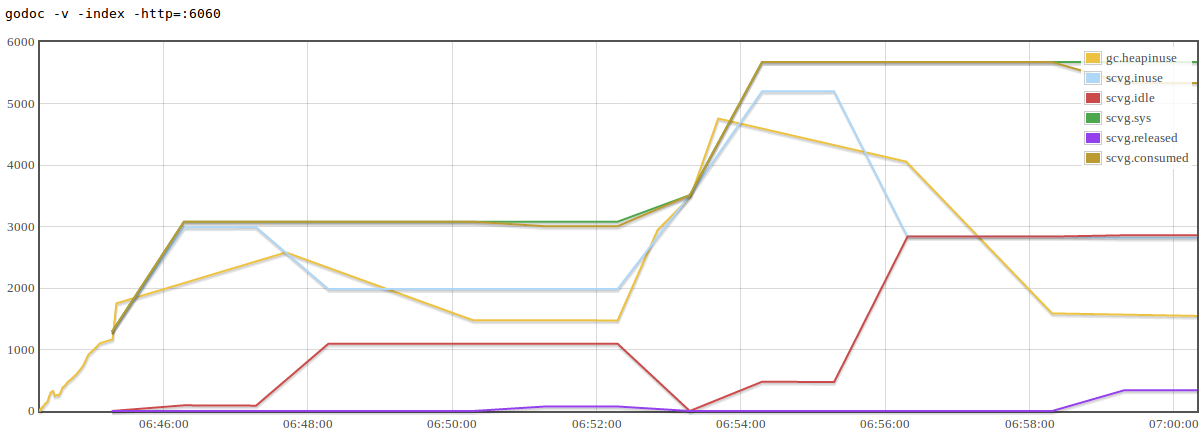
The scavenger runs on a timer, currently every two minutes, so will only start to report its data to gcviz a few minutes after the program starts. Here is an example after running for about 15 minutes.

Screenshot from 2014-07-11 17:01:31
Some interesting points to note in this graph are

  • scvg.sys represents the total amount of memory requested from the operating system, this is roughly analogous to the VSS value reported by tools like top.
  • scvg.inuse is the amount of memory in use by the whole heap, which may include dead objects. scvg.inuse and gc.heapinuse may not track each other exactly as they are reported at different times.
  • scvg.idle represents memory that is currently unused by the garbage collector, that is, used to contain dead objects, but is now unused after garbage collection.
  • When the scavenger runs, scvg.idle grows as scvg.inuse shrinks.
  • If memory remains idle for long enough the scavenger will inform the operating system that it is no longer needed, this is reported by scvg.released and matches a drop in scvg.consumedThe operating system is free to ignore this request, and frequently does.

Conclusion

The code is open source on Github, so go get it and try it on your application.

go get -u -v github.com/davecheney/gcvis

I’m very keen to hear from other Go users if gcvis is useful for you. Pull requests and bug reports are also most welcome.

A special thanks to Damian Gryski, Matthew Holt, and Bill Kennedy, for their suggestions and feedback.

Ice cream makers and data races

This is a post about data races. The code for this post lives on Github, github.com/davecheney/benandjerry.

The example program simulates two Ice cream makers, Ben and Jerry, who greet their customers randomly.

package main

import "fmt"

type IceCreamMaker interface {
        // Hello greets a customer
        Hello()
}

type Ben struct {
        name string
}

func (b *Ben) Hello() {
        fmt.Printf("Ben says, \"Hello my name is %s\"\n", b.name)
}

type Jerry struct {
        name string
}

func (j *Jerry) Hello() {
        fmt.Printf("Jerry says, \"Hello my name is %s\"\n", j.name)
}

func main() {
        var ben = &Ben{"Ben"}
        var jerry = &Jerry{"Jerry"}
        var maker IceCreamMaker = ben

        var loop0, loop1 func()

        loop0 = func() {
                maker = ben
                go loop1()
        }

        loop1 = func() {
                maker = jerry
                go loop0()
        }

        go loop0()

        for {
                maker.Hello()
        }
}

It’s a data race, silly

Most programmers should easily spot the data race in this program.

The loop functions are changing the value of maker without using a lock, so it is undefined which implementation of Hello will be called when maker.Hello() is executed by the for loop in the main function.

Some programmers appear to be happy with this data race; either Ben or Jerry will greet the customer, it doesn’t matter which.

Lets run this code, and see what happens.

% env GOMAXPROCS=2 go run main.go
...
Ben says, "Hello my name is Ben"
Jerry says, "Hello my name is Jerry"
Ben says, "Hello my name is Jerry"
Ben says, "Hello my name is Ben"
...

What! Hold up. Ben sometimes thinks that he is Jerry. How is this possible?

Interface values

The key to understanding this race is to understand how interface values are represented in memory.

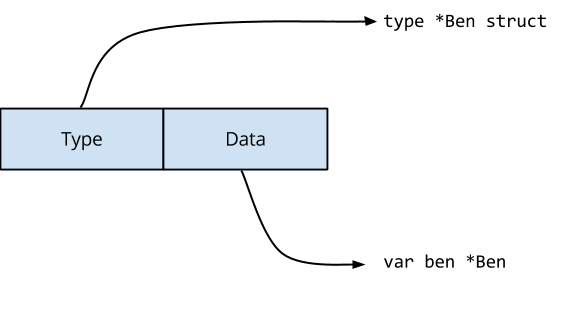
An interface is conceptually a struct with two fields.
Interface
If we were to describe an interface in Go, it would look something like this.

type interface struct {
       Type uintptr     // points to the type of the interface implementation
       Data uintptr     // holds the data for the interface's receiver
}

Type points to a structure that describes the type of the value that implements this interface. Data points to the value of the implementation itself. The contents of Data are passed as the receiver of any method called via the interface.

For the statement var maker IceCreamMaker = ben, the compiler will generate code that does the following.
var marker IceCreamMaker = ben
The interface’s Type field is set to point to the definition of the *Ben type, and the Data field contains a copy of ben, that is, a pointer to a Ben value.

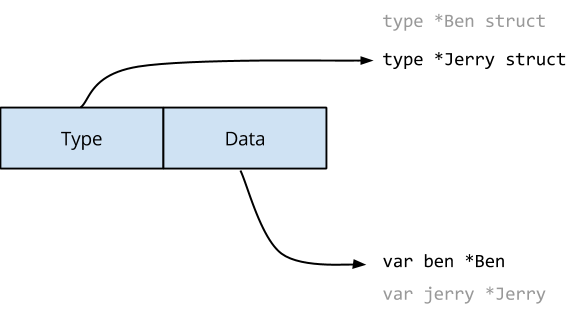
When loop1() executes the statement, maker = jerry, both fields of the interface value must be updated.
marker = jerry

Type now points to the definition of a *Jerry and Data contains a pointer to an instance of Jerry.

The Go memory model says that writes to a single machine word will be atomic, but interfaces are two word values. It is possible that another goroutine may observe the contents of the interface value while it is being changed. In this case it may see something like this
Data race in progress
And so Jerry‘s Hello() function is called with ben as the receiver.

Conclusion

There is no such thing as a safe data race. Your program either has no data races, or its operation is undefined.

In this example, the layout of the Ben and Jerry structs were identical in memory, so they were in some sense compatible. Imagine the chaos that would occur if they had different memory representations (this is left as an exercise to the reader).

The Go race detector will spot this error, and many others, and is as simple to use as adding the -race flag to your go test, build, or install command.

Bonus question

In the example code, the Hello method is declared on Ben or Jerry‘s pointer receiver. If this were instead declared as a method on the Ben or Jerry value, would this solve the data race ?

Futher reading

Five things that make Go fast

Anthony Starks has remixed my original Google Present based slides using his fantastic Deck presentation tool. You can check out his remix over on his blog, mindchunk.blogspot.com.au/2014/06/remixing-with-deck.


I was recently invited to give a talk at Gocon, a fantastic Go conference held semi-annually in Tokyo, Japan. Gocon 2014 was an entirely community-run one day event combining training and an afternoon of presentations surrounding the theme of Go in production.

The following is the text of my presentation. The original text was structured to force me to speak slowly and clearly, so I have taken the liberty of editing it slightly to be more readable.

I want to thank Bill Kennedy, Minux Ma, and especially Josh Bleecher Snyder, for their assistance in preparing this talk.


Good afternoon.

My name is David.

I am delighted to be here at Gocon today. I have wanted to come to this conference for two years and I am very grateful to the organisers for extending me the opportunity to present to you today.

Gocon 2014
I want to begin my talk with a question.

Why are people choosing to use Go ?

When people talk about their decision to learn Go, or use it in their product, they have a variety of answers, but there always three that are at the top of their list

Gocon 2014
These are the top three.

The first, Concurrency.

Go’s concurrency primitives are attractive to programmers who come from single threaded scripting languages like Nodejs, Ruby, or Python, or from languages like C++ or Java with their heavyweight threading model.

Ease of deployment.

We have heard today from experienced Gophers who appreciate the simplicity of deploying Go applications.
Gocon 2014

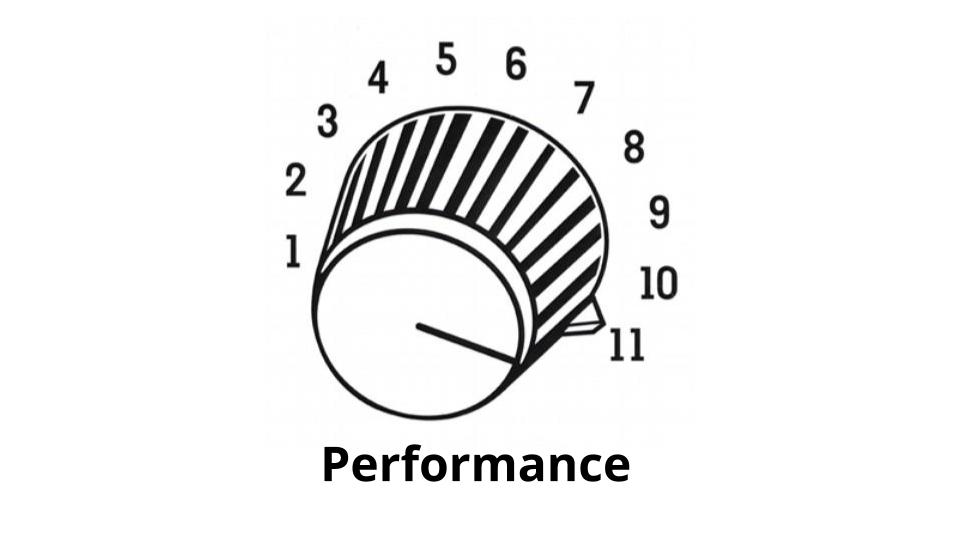
This leaves Performance.

I believe an important reason why people choose to use Go is because it is fast.

Gocon 2014 (4)

For my talk today I want to discuss five features that contribute to Go’s performance.

I will also share with you the details of how Go implements these features.

Gocon 2014 (5)

The first feature I want to talk about is Go’s efficient treatment and storage of values.
Gocon 2014 (6)

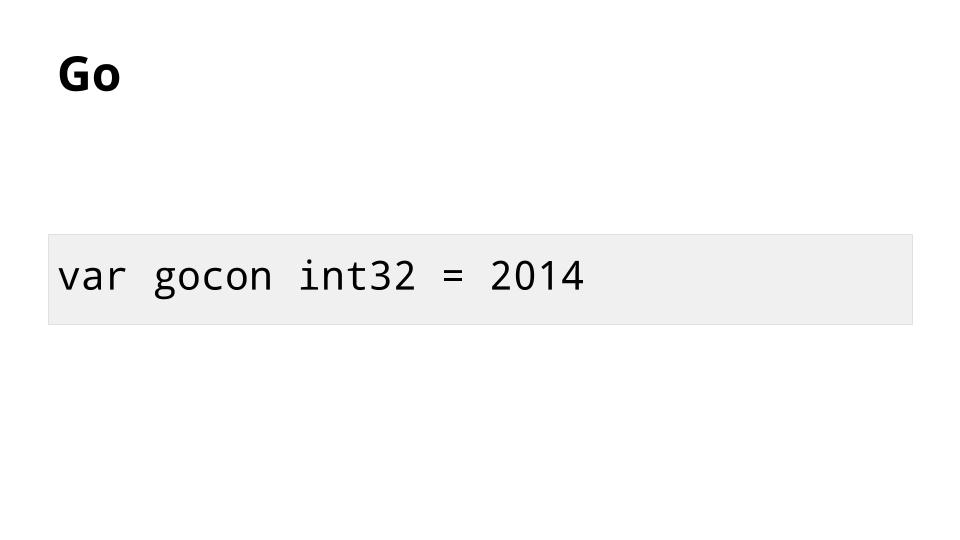
This is an example of a value in Go. When compiled, gocon consumes exactly four bytes of memory.

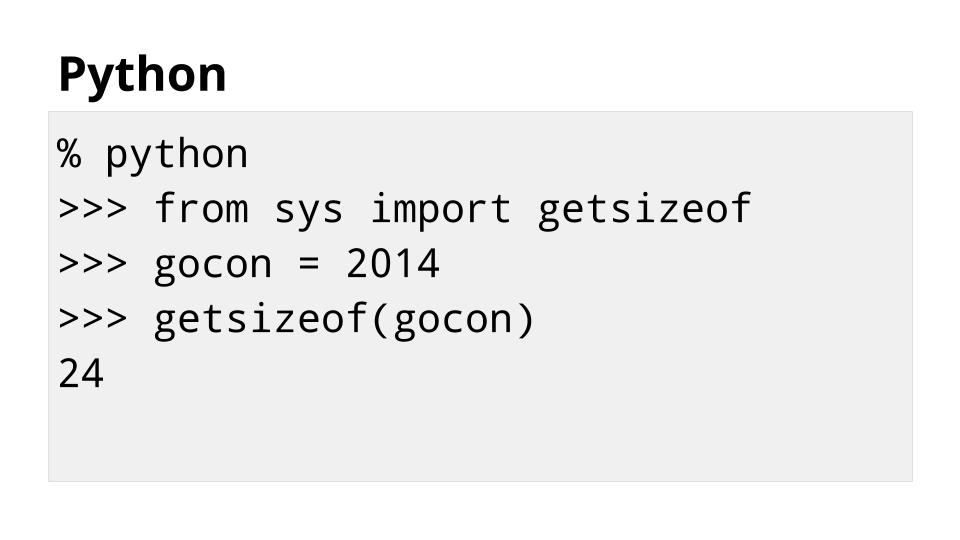
Let’s compare Go with some other languages
Gocon 2014 (7)

Due to the overhead of the way Python represents variables, storing the same value using Python consumes six times more memory.

This extra memory is used by Python to track type information, do reference counting, etc

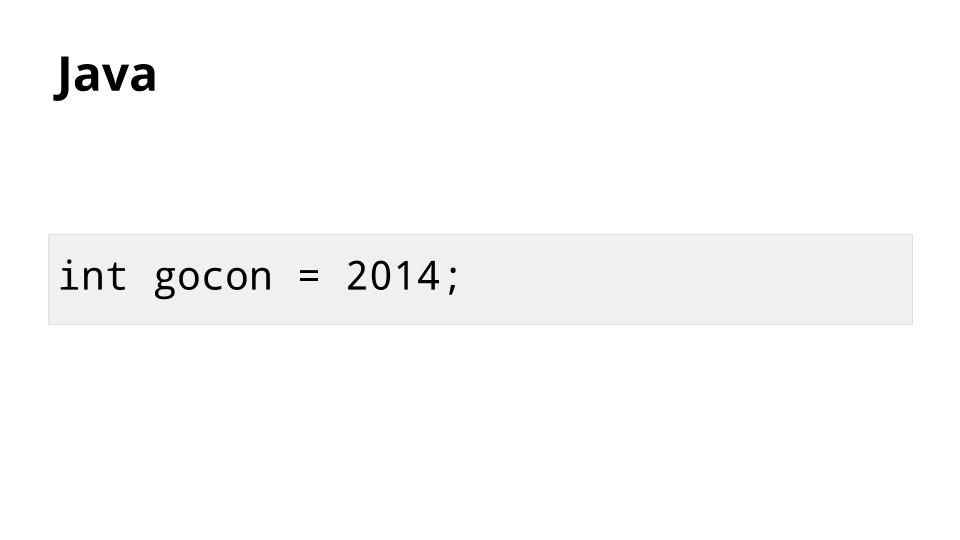
Let’s look at another example:
Gocon 2014 (8)

Similar to Go, the Java int type consumes 4 bytes of memory to store this value.

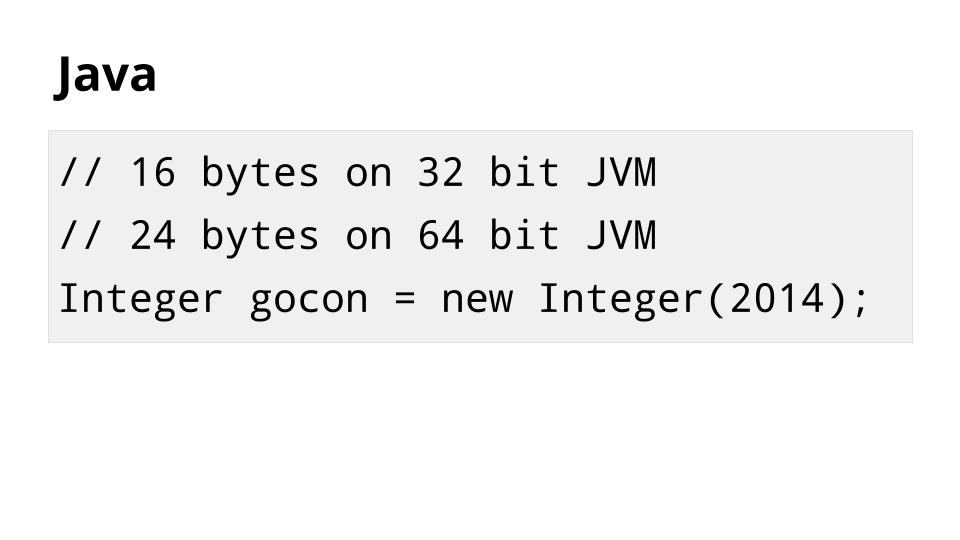
However, to use this value in a collection like a List or Map, the compiler must convert it into an Integer object.
Gocon 2014 (9)

So an integer in Java frequently looks more like this and consumes between 16 and 24 bytes of memory.

Why is this important ? Memory is cheap and plentiful, why should this overhead matter ?
Gocon 2014 (10)

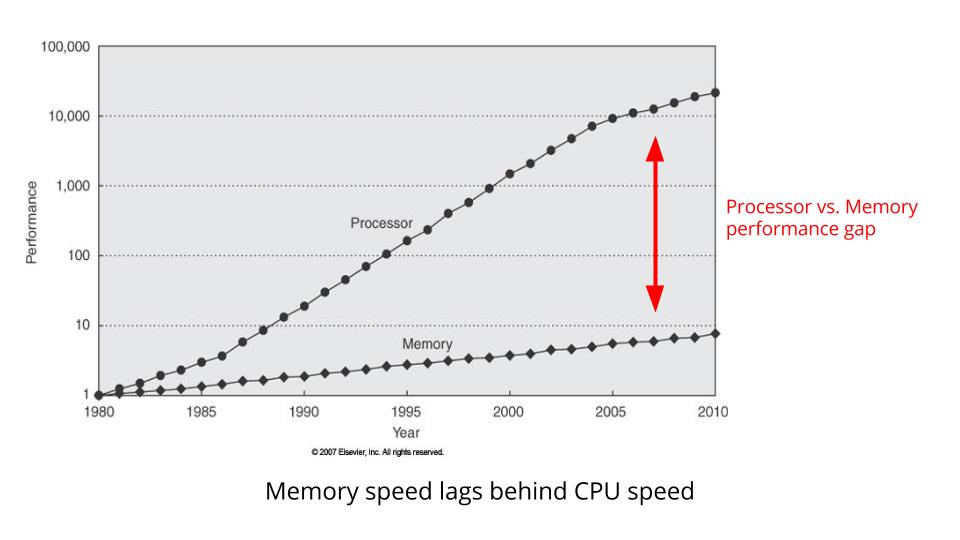
This is a graph showing CPU clock speed vs memory bus speed.

Notice how the gap between CPU clock speed and memory bus speed continues to widen.

The difference between the two is effectively how much time the CPU spends waiting for memory.
Gocon 2014 (11)

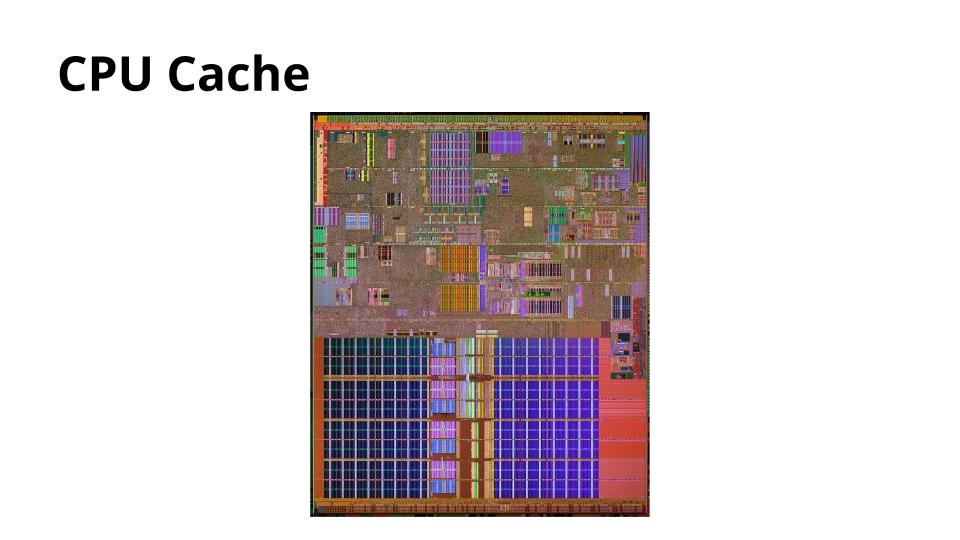
Since the late 1960’s CPU designers have understood this problem.

Their solution is a cache, an area of smaller, faster memory which is inserted between the CPU and main memory.
Gocon 2014 (12)

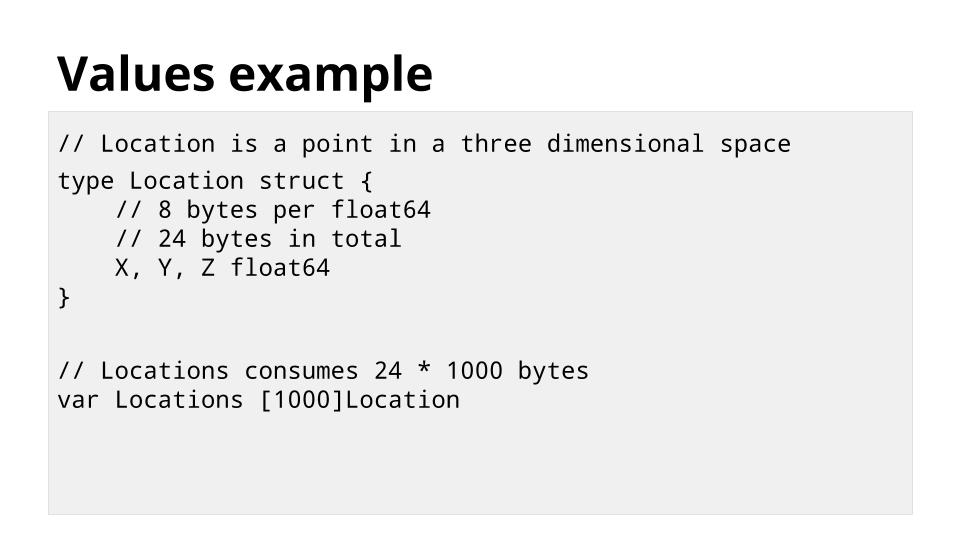
This is a Location type which holds the location of some object in three dimensional space. It is written in Go, so each Location consumes exactly 24 bytes of storage.

We can use this type to construct an array type of 1,000 Locations, which consumes exactly 24,000 bytes of memory.

Inside the array, the Location structures are stored sequentially, rather than as pointers to 1,000 Location structures stored randomly.

This is important because now all 1,000 Location structures are in the cache in sequence, packed tightly together.
Gocon 2014 (13)

Go lets you create compact data structures, avoiding unnecessary indirection.

Compact data structures utilise the cache better.

Better cache utilisation leads to better performance.

Gocon 2014 (14)

Function calls are not free.

Gocon 2014 (15)

Three things happen when a function is called.

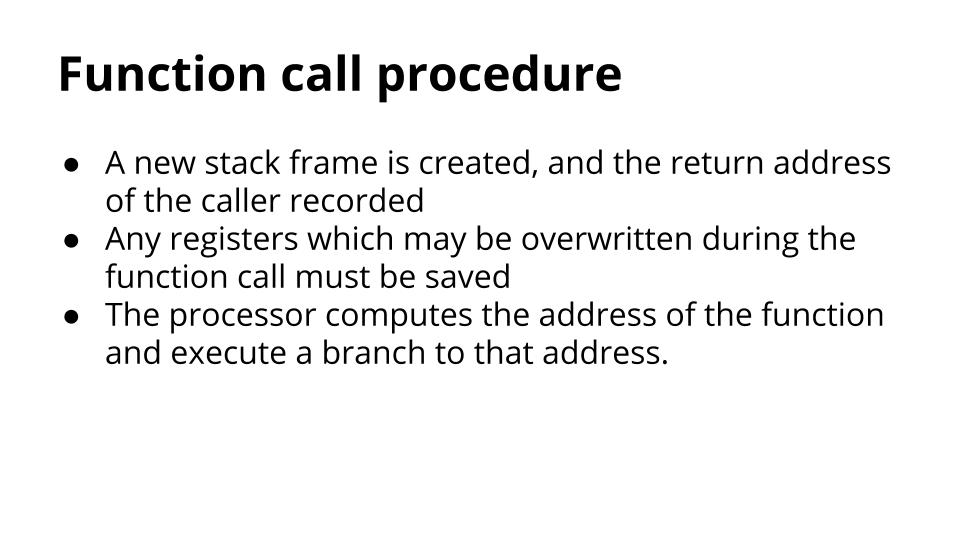
A new stack frame is created, and the details of the caller recorded.

Any registers which may be overwritten during the function call are saved to the stack.

The processor computes the address of the function and executes a branch to that new address.

Gocon 2014 (16)

Because function calls are very common operations, CPU designers have worked hard to optimise this procedure, but they cannot eliminate the overhead.

Depending on what the function does, this overhead may be trivial or significant.

A solution to reducing function call overhead is an optimisation technique called Inlining.
Gocon 2014 (17)

The Go compiler inlines a function by treating the body of the function as if it were part of the caller.

Inlining has a cost; it increases binary size.

It only makes sense to inline when the overhead of calling a function is large relative to the work the function does, so only simple functions are candidates for inlining.

Complicated functions are usually not dominated by the overhead of calling them and are therefore not inlined.
Gocon 2014 (18)

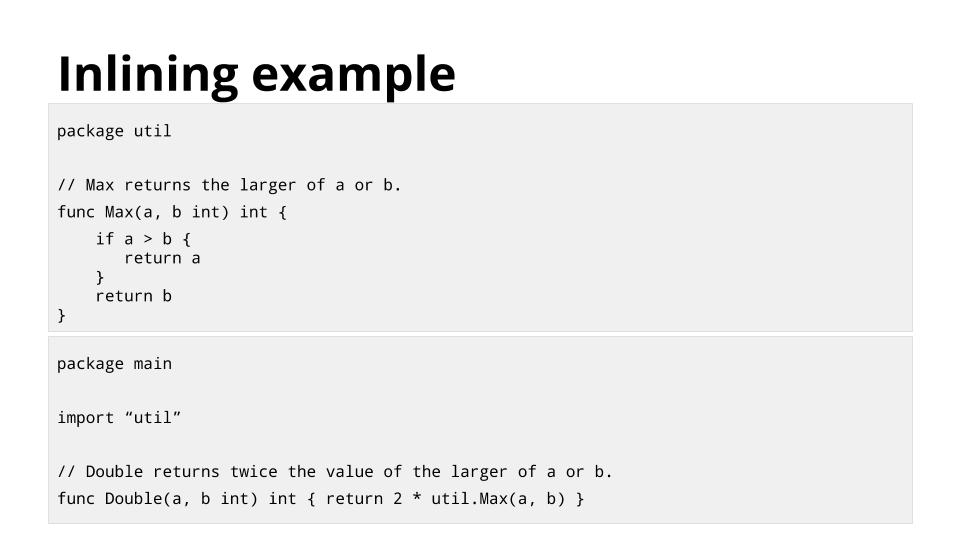
This example shows the function Double calling util.Max.

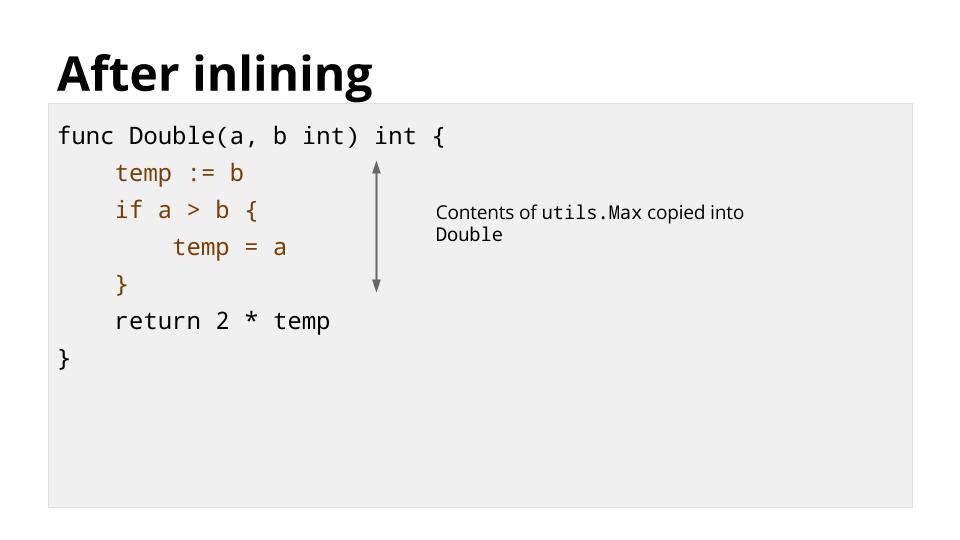
To reduce the overhead of the call to util.Max, the compiler can inline util.Max into Double, resulting in something like this
Gocon 2014 (19)

After inlining there is no longer a call to util.Max, but the behaviour of Double is unchanged.

Inlining isn’t exclusive to Go. Almost every compiled or JITed language performs this optimisation. But how does inlining in Go work?

The Go implementation is very simple. When a package is compiled, any small function that is suitable for inlining is marked and then compiled as usual.

Then both the source of the function and the compiled version are stored.
Gocon 2014 (20)

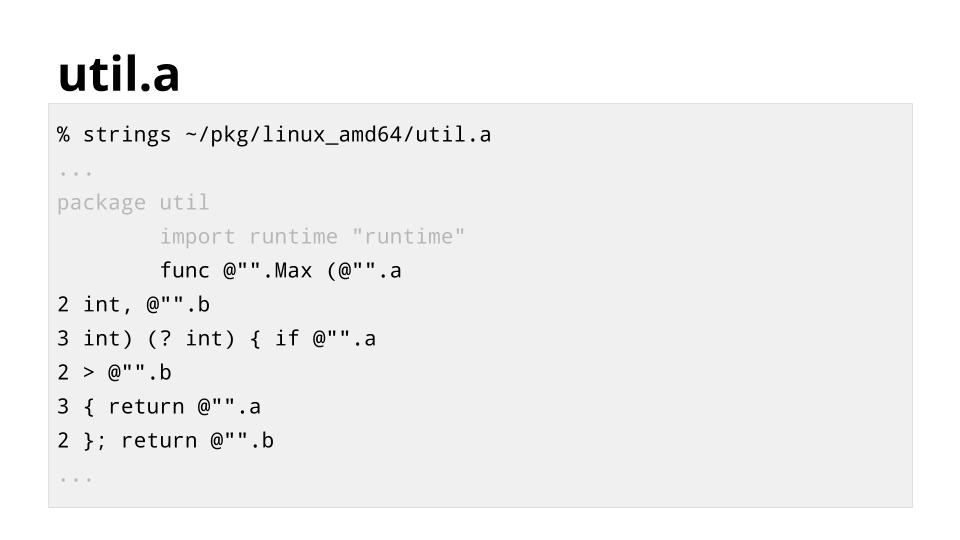
This slide shows the contents of util.a. The source has been transformed a little to make it easier for the compiler to process quickly.

When the compiler compiles Double it sees that util.Max is inlinable, and the source of util.Max is available.

Rather than insert a call to the compiled version of util.Max, it can substitute the source of the original function.

Having the source of the function enables other optimizations.
Gocon 2014 (21)

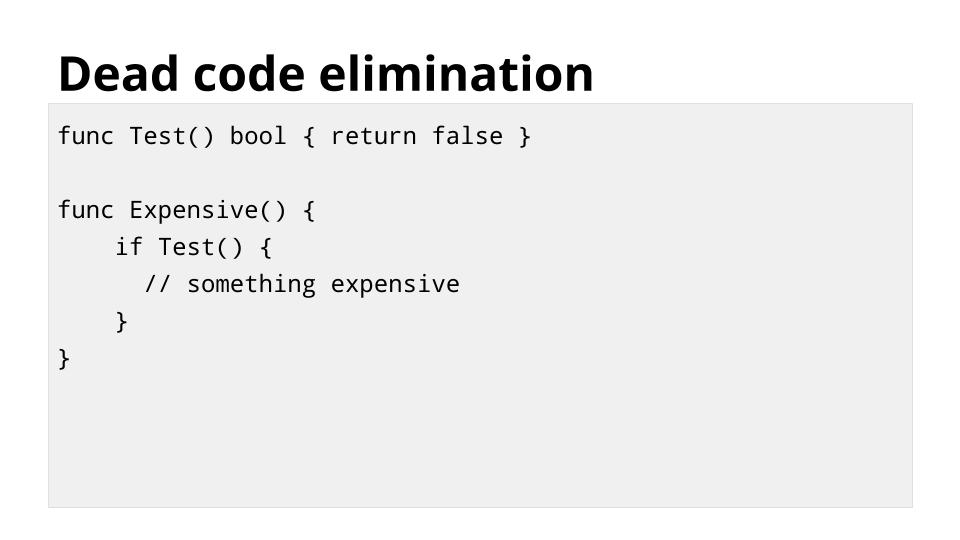
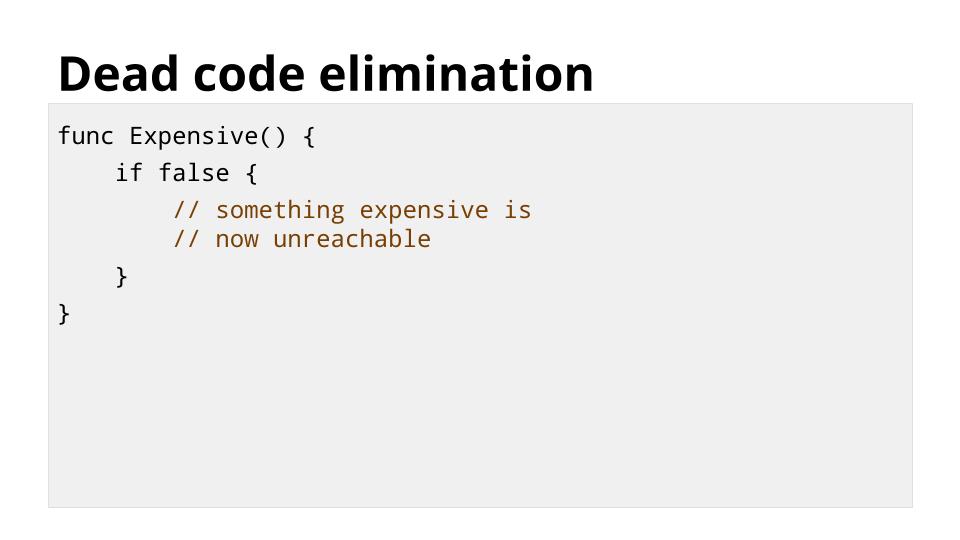
In this example, although the function Test always returns false, Expensive cannot know that without executing it.

When Test is inlined, we get something like this
Gocon 2014 (22)

The compiler now knows that the expensive code is unreachable.

Not only does this save the cost of calling Test, it saves compiling or running any of the expensive code that is now unreachable.

The Go compiler can automatically inline functions across files and even across packages. This includes code that calls inlinable functions from the standard library.

Gocon 2014 (23)

Mandatory garbage collection makes Go a simpler and safer language.

This does not imply that garbage collection makes Go slow, or that garbage collection is the ultimate arbiter of the speed of your program.

What it does mean is memory allocated on the heap comes at a cost. It is a debt that costs CPU time every time the GC runs until that memory is freed.
Gocon 2014 (24)

There is however another place to allocate memory, and that is the stack.

Unlike C, which forces you to choose if a value will be stored on the heap, via malloc, or on the stack, by declaring it inside the scope of the function, Go implements an optimisation called escape analysis.
Gocon 2014 (25)

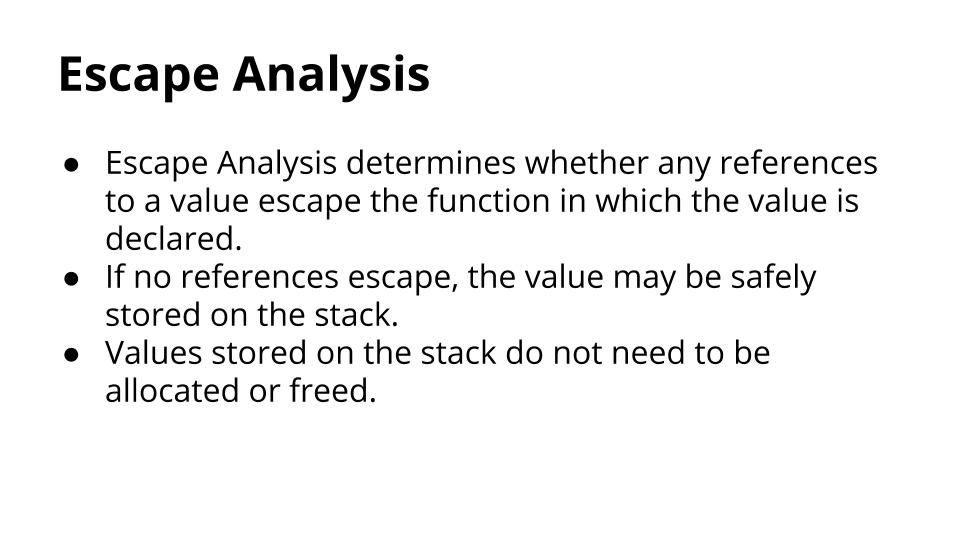
Escape analysis determines whether any references to a value escape the function in which the value is declared.

If no references escape, the value may be safely stored on the stack.

Values stored on the stack do not need to be allocated or freed.

Lets look at some examples
Gocon 2014 (26)

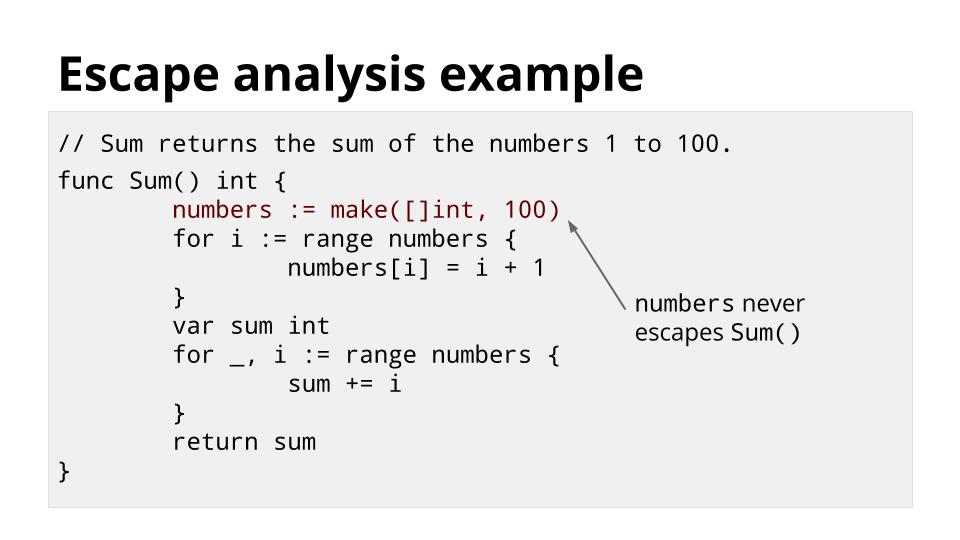
Sum adds the numbers between 1 and 100 and returns the result. This is a rather unusual way to do this, but it illustrates how Escape Analysis works.

Because the numbers slice is only referenced inside Sum, the compiler will arrange to store the 100 integers for that slice on the stack, rather than the heap.

There is no need to garbage collect numbers, it is automatically freed when Sum returns.
Gocon 2014 (27)

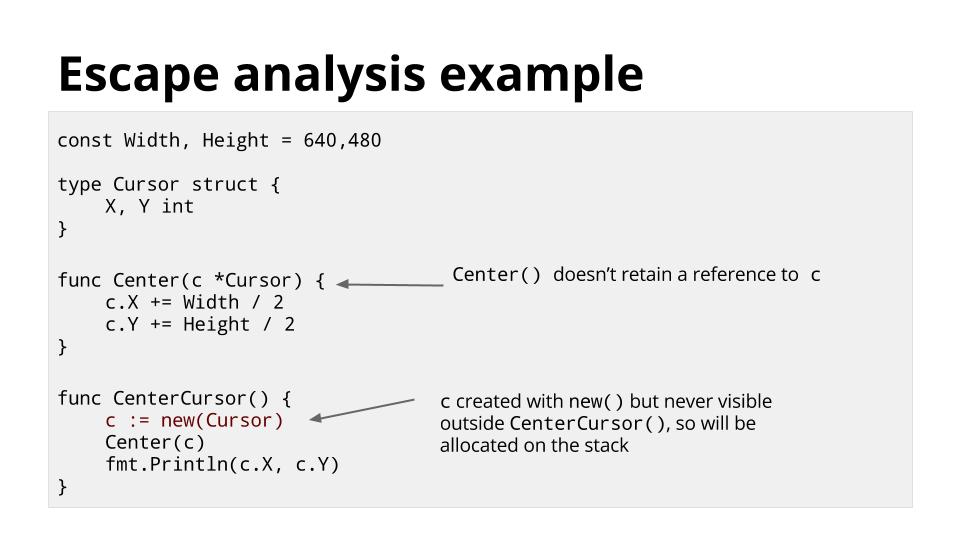
This second example is also a little contrived. In CenterCursor we create a new Cursor and store a pointer to it in c.

Then we pass c to the Center() function which moves the Cursor to the center of the screen.

Then finally we print the X and Y locations of that Cursor.

Even though c was allocated with the new function, it will not be stored on the heap, because no reference c escapes the CenterCursor function.
Gocon 2014 (28)

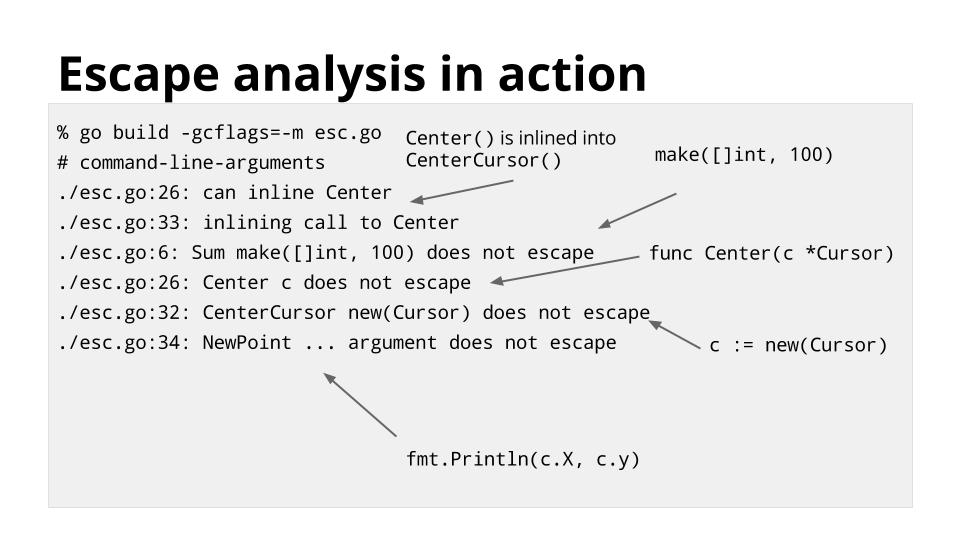
Go’s optimisations are always enabled by default. You can see the compiler’s escape analysis and inlining decisions with the -gcflags=-m switch.

Because escape analysis is performed at compile time, not run time, stack allocation will always be faster than heap allocation, no matter how efficient your garbage collector is.

I will talk more about the stack in the remaining sections of this talk.

Gocon 2014 (30)

Go has goroutines. These are the foundations for concurrency in Go.

I want to step back for a moment and explore the history that leads us to goroutines.

In the beginning computers ran one process at a time. Then in the 60’s the idea of multiprocessing, or time sharing became popular.

In a time-sharing system the operating systems must constantly switch the attention of the CPU between these processes by recording the state of the current process, then restoring the state of another.

This is called process switching.
Gocon 2014 (29)

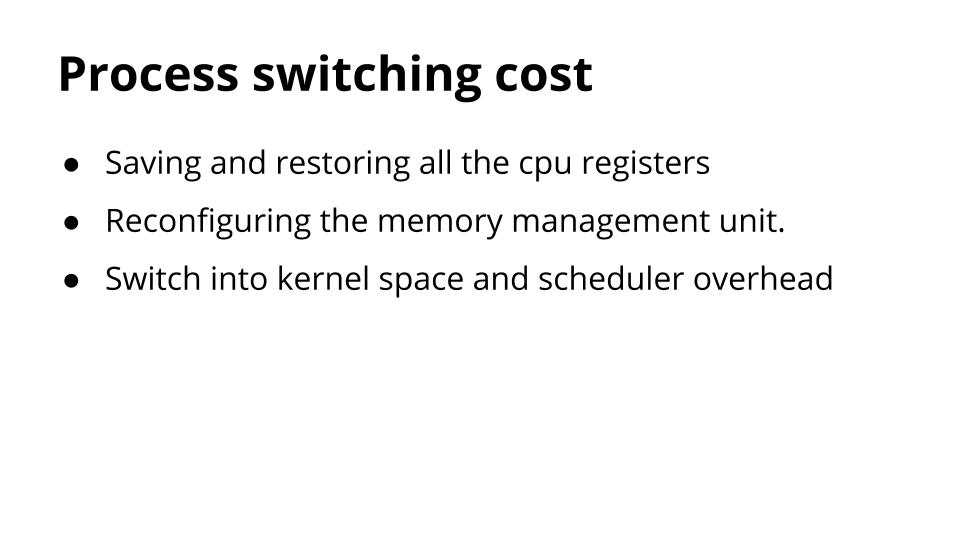
There are three main costs of a process switch.

First is the kernel needs to store the contents of all the CPU registers for that process, then restore the values for another process.

The kernel also needs to flush the CPU’s mappings from virtual memory to physical memory as these are only valid for the current process.

Finally there is the cost of the operating system context switch, and the overhead of the scheduler function to choose the next process to occupy the CPU.
Gocon 2014 (31)

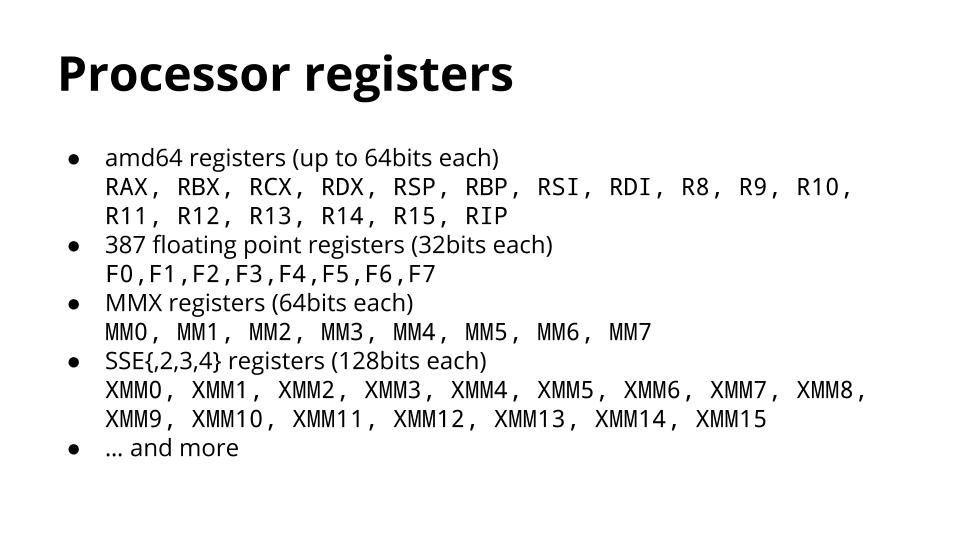
There are a surprising number of registers in a modern processor. I have difficulty fitting them on one slide, which should give you a clue how much time it takes to save and restore them.

Because a process switch can occur at any point in a process’ execution, the operating system needs to store the contents of all of these registers because it does not know which are currently in use.
Gocon 2014 (32)

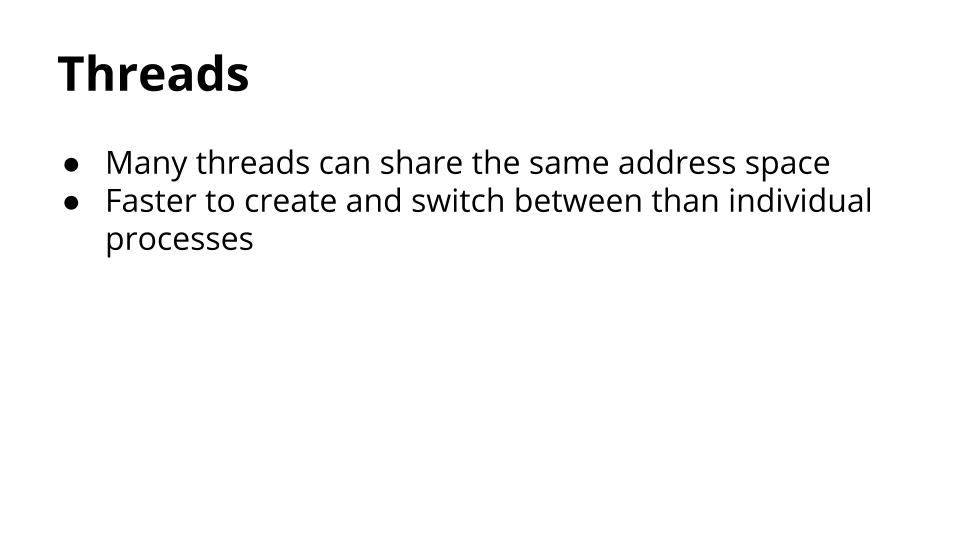
This lead to the development of threads, which are conceptually the same as processes, but share the same memory space.

As threads share address space, they are lighter than processes so are faster to create and faster to switch between.
Gocon 2014 (33)

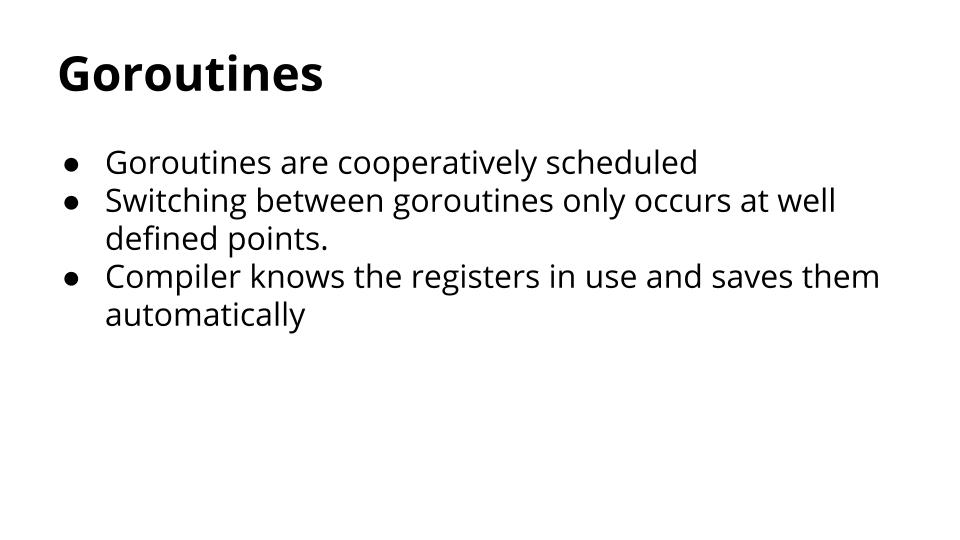
Goroutines take the idea of threads a step further.

Goroutines are cooperatively scheduled, rather than relying on the kernel to manage their time sharing.

The switch between goroutines only happens at well defined points, when an explicit call is made to the Go runtime scheduler.

The compiler knows the registers which are in use and saves them automatically.
Gocon 2014 (34)

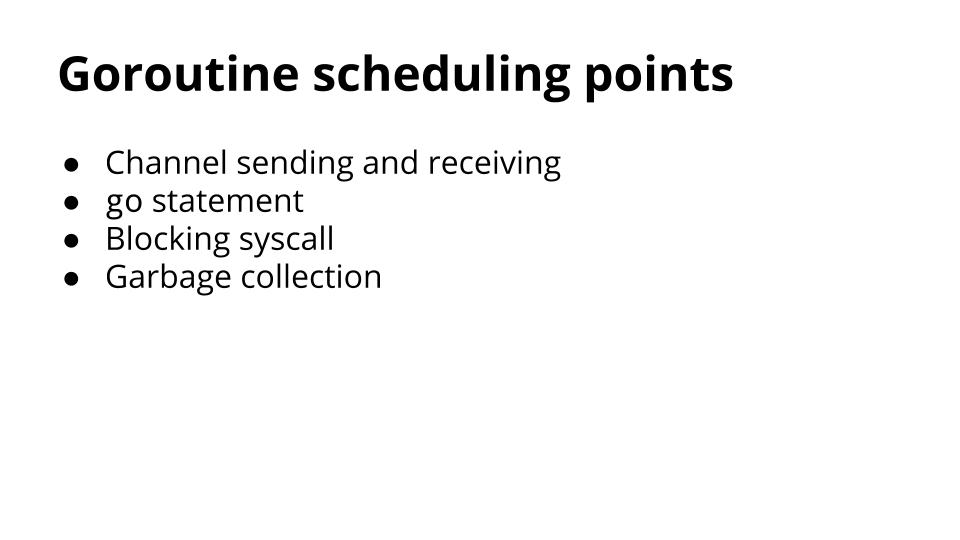
While goroutines are cooperatively scheduled, this scheduling is handled for you by the runtime.

Places where Goroutines may yield to others are:

  • Channel send and receive operations, if those operations would block.
  • The Go statement, although there is no guarantee that new goroutine will be scheduled immediately.
  • Blocking syscalls like file and network operations.
  • After being stopped for a garbage collection cycle.
Gocon 2014 (35)

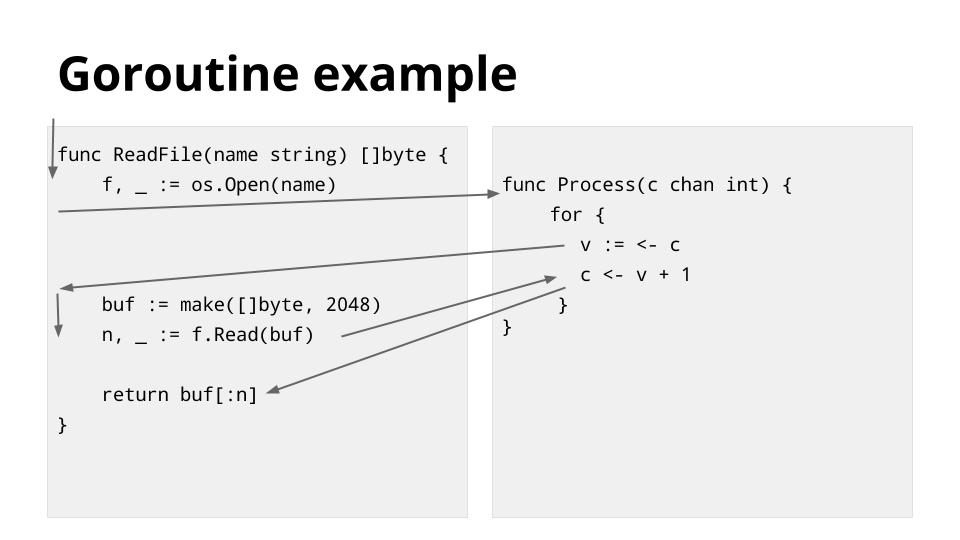
This an example to illustrate some of the scheduling points described in the previous slide.

The thread, depicted by the arrow, starts on the left in the ReadFile function. It encounters os.Open, which blocks the thread while waiting for the file operation to complete, so the scheduler switches the thread to the goroutine on the right hand side.

Execution continues until the read from the c chan blocks, and by this time the os.Open call has completed so the scheduler switches the thread back the left hand side and continues to the file.Read function, which again blocks on file IO.

The scheduler switches the thread back to the right hand side for another channel operation, which has unblocked during the time the left hand side was running, but it blocks again on the channel send.

Finally the thread switches back to the left hand side as the Read operation has completed and data is available.
Gocon 2014 (36)

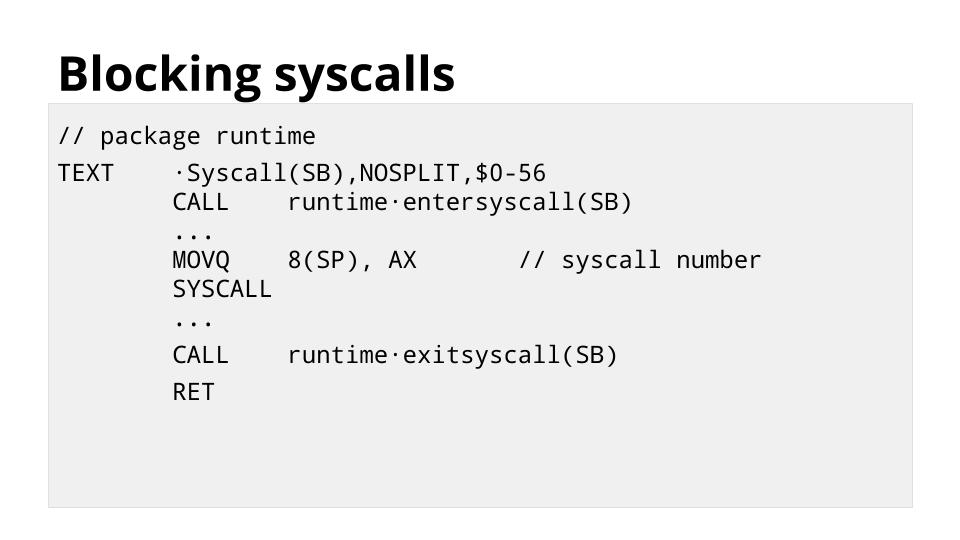
This slide shows the low level runtime.Syscall function which is the base for all functions in the os package.

Any time your code results in a call to the operating system, it will go through this function.

The call to entersyscall informs the runtime that this thread is about to block.

This allows the runtime to spin up a new thread which will service other goroutines while this current thread blocked.

This results in relatively few operating system threads per Go process, with the Go runtime taking care of assigning a runnable Goroutine to a free operating system thread.

Gocon 2014 (37)

In the previous section I discussed how goroutines reduce the overhead of managing many, sometimes hundreds of thousands of concurrent threads of execution.

There is another side to the goroutine story, and that is stack management, which leads me to my final topic.
Gocon 2014 (39)

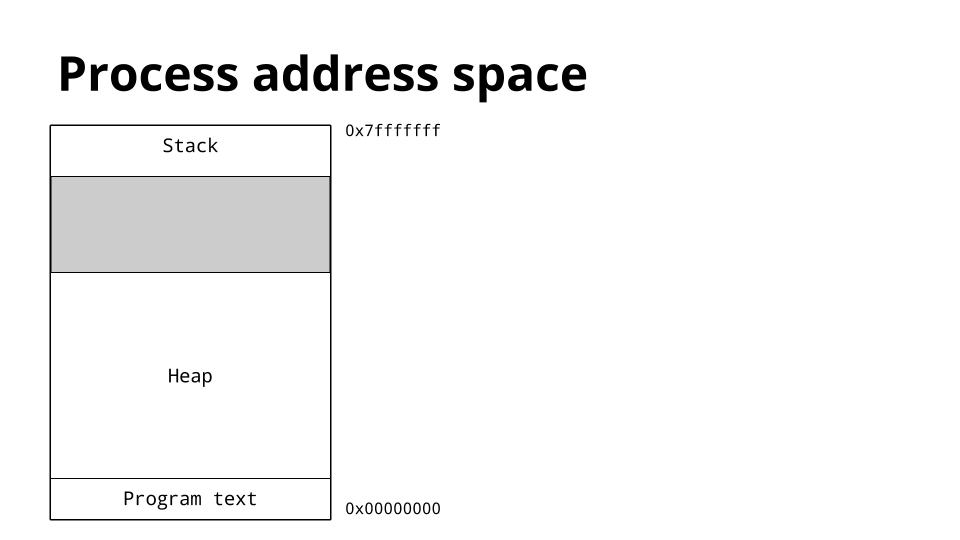
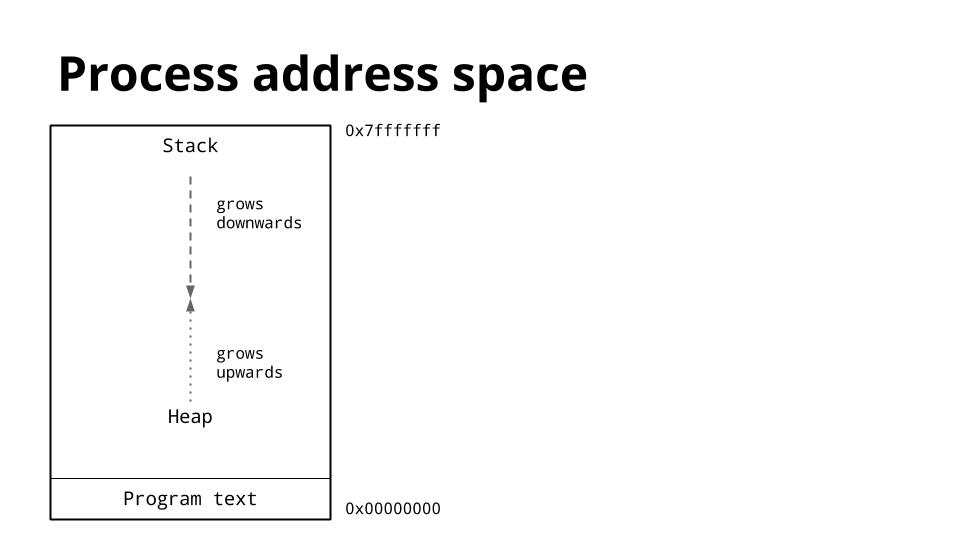
This is a diagram of the memory layout of a process. The key thing we are interested is the location of the heap and the stack.

Traditionally inside the address space of a process, the heap is at the bottom of memory, just above the program (text) and grows upwards.

The stack is located at the top of the virtual address space, and grows downwards.
Gocon 2014 (40)

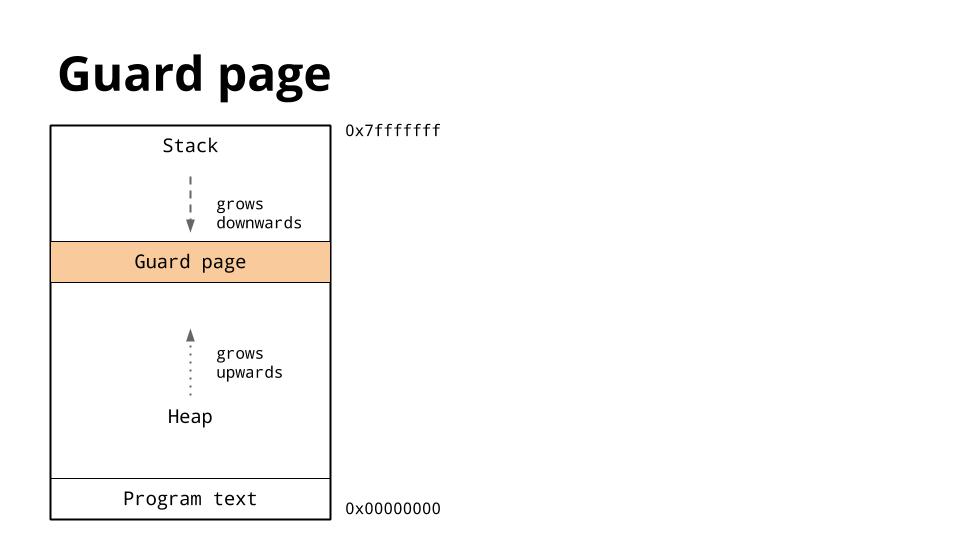
Because the heap and stack overwriting each other would be catastrophic, the operating system usually arranges to place an area of unwritable memory between the stack and the heap to ensure that if they did collide, the program will abort.

This is called a guard page, and effectively limits the stack size of a process, usually in the order of several megabytes.
Gocon 2014 (41)

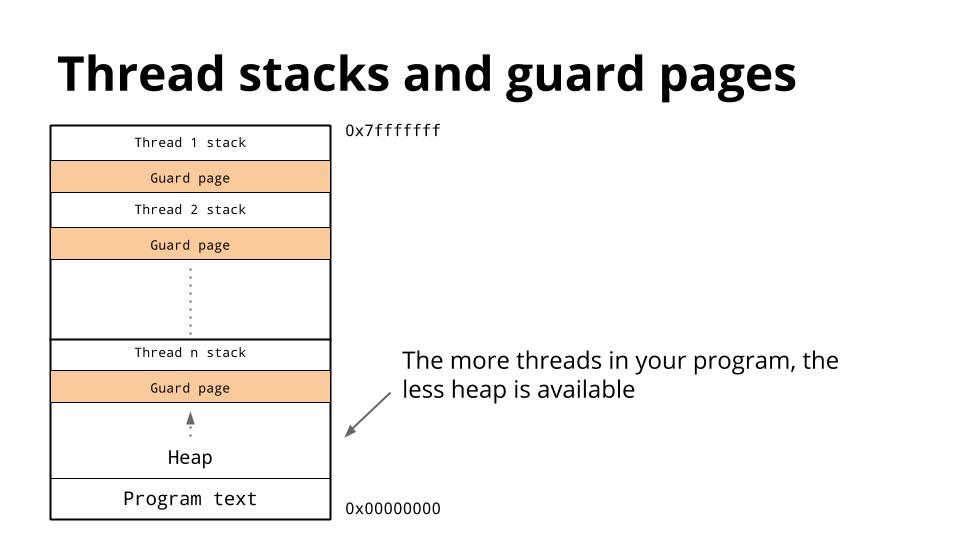
We’ve discussed that threads share the same address space, so for each thread, it must have its own stack.

Because it is hard to predict the stack requirements of a particular thread, a large amount of memory is reserved for each thread’s stack along with a guard page.

The hope is that this is more than will ever be needed and the guard page will never be hit.

The downside is that as the number of threads in your program increases, the amount of available address space is reduced.
Gocon 2014 (42)

We’ve seen that the Go runtime schedules a large number of goroutines onto a small number of threads, but what about the stack requirements of those goroutines ?

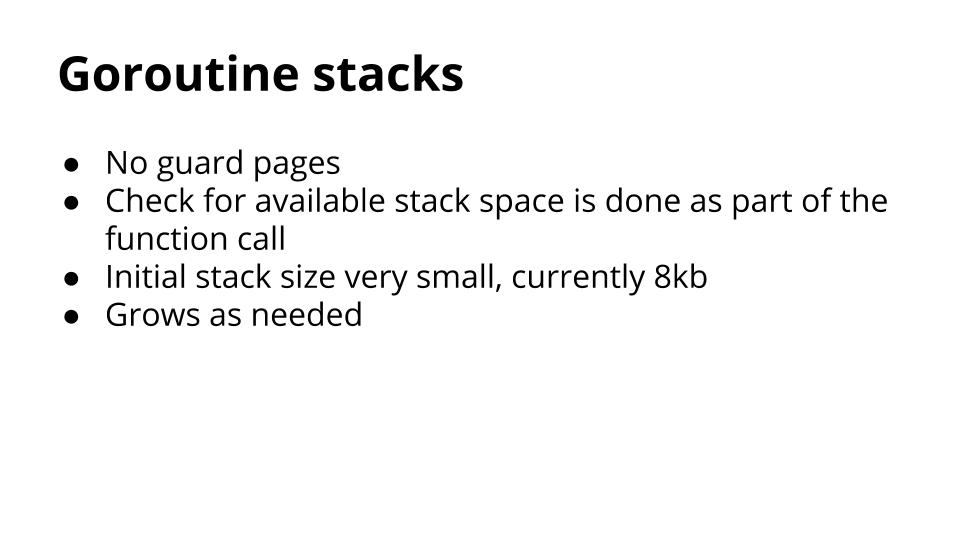
Instead of using guard pages, the Go compiler inserts a check as part of every function call to check if there is sufficient stack for the function to run. If there is not, the runtime can allocate more stack space.

Because of this check, a goroutines initial stack can be made much smaller, which in turn permits Go programmers to treat goroutines as cheap resources.
Gocon 2014 (43)

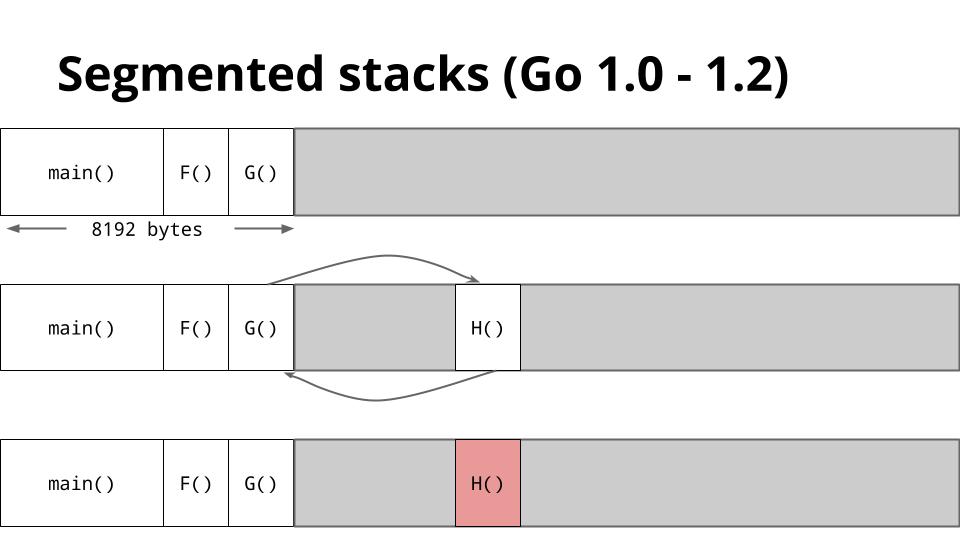
This is a slide that shows how stacks are managed in Go 1.2.

When G calls to H there is not enough space for H to run, so the runtime allocates a new stack frame from the heap, then runs H on that new stack segment. When H returns, the stack area is returned to the heap before returning to G.
Gocon 2014 (44)

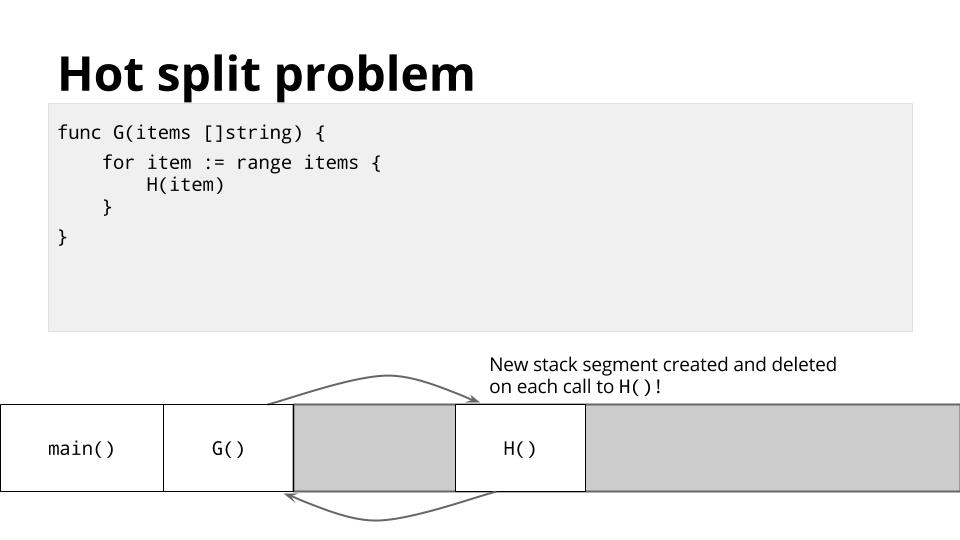
This method of managing the stack works well in general, but for certain types of code, usually recursive code, it can cause the inner loop of your program to straddle one of these stack boundaries.

For example, in the inner loop of your program, function G may call H many times in a loop,

Each time this will cause a stack split. This is known as the hot split problem.
Gocon 2014 (45)

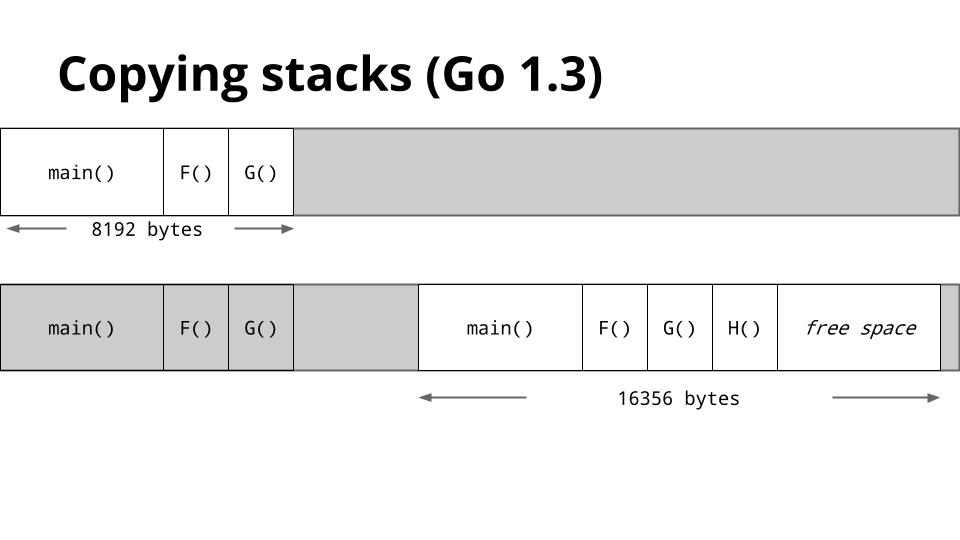
To solve hot splits, Go 1.3 has adopted a new stack management method.

Instead of adding and removing additional stack segments, if the stack of a goroutine is too small, a new, larger, stack will be allocated.

The old stack’s contents are copied to the new stack, then the goroutine continues with its new larger stack.

After the first call to H the stack will be large enough that the check for available stack space will always succeed.

This resolves the hot split problem.

Gocon 2014 (46)

Values, Inlining, Escape Analysis, Goroutines, and segmented/copying stacks.

These are the five features that I chose to speak about today, but they are by no means the only things that makes Go a fast programming language, just as there more that three reasons that people cite as their reason to learn Go.

As powerful as these five features are individually, they do not exist in isolation.

For example, the way the runtime multiplexes goroutines onto threads would not be nearly as efficient without growable stacks.

Inlining reduces the cost of the stack size check by combining smaller functions into larger ones.

Escape analysis reduces the pressure on the garbage collector by automatically moving allocations from the heap to the stack.

Escape analysis is also provides better cache locality.

Without growable stacks, escape analysis might place too much pressure on the stack.

Gocon 2014 (47)

* Thank you to the Gocon organisers for permitting me to speak today
* twitter / web / email details
* thanks to @offbymany, @billkennedy_go, and Minux for their assistance in preparing this talk.
What does go build build ?

For packages

  • go build builds your package then discards the results.
  • go install builds then installs the package in your $GOPATH/pkg directory.

For commands

    • go build builds the command and leaves the result the current working directory.
    • go install builds the command in a temporary directory then moves it to $GOPATH/bin.

If you liked this post you may also find Using go test, build and install helpful.

On declaring variables

Go has several ways to declare a variable. Possibly there are more ways than are strictly required but with the Go 1 contract in effect it’s not going to change.

This short post gives examples of how I decide which variable declaration syntax to use. These are just suggestions, they make sense to me, but I’m sure others have equally strong justifications for alternative arrangements.

When declaring (but not initialising) a variable consider using this syntax

var num int

As Go does not permit uninitialised variables, num will be initialised to the zero value.

Some other examples of this form might be

var things []Thing // an empty slice of Things
for t := range ThingCreator() {
        things = append(things, t)
}

var thing Thing // empty Thing struct 
json.Unmarshall(reader, &thing)

The key is that var acts as a clue that the variable has been deliberately declared as the zero value of the indicated type.

When declaring and initialising, consider using the short declaration syntax. For example

num := rand.Int()

The lack of var is a signal that this variable has been initialised. I also find that by avoiding declaring the type of the variable and infering it from the right hand side of the assignment makes re-factoring easier in the future.

Of course, with any rule of thumb, there are exceptions.

min, max := 0, 1000

But maybe in this case min and max are really constants.

var length uint32 = 0x80

Here length may be being used with a library which requires a specific numeric type and this is probably more readable than

length := uint32(0x80)

Go 1.3 linker improvements

Go obtains much of its compilation speed from the Plan 9 compiler, of which it is a direct descendant. The Plan 9 toolchain deferred much of the work traditionally performed by a compiler to the linking stage and its performance was summarised in section 8 of this paper

The new compilers compile quickly, load slowly, and produce medium quality object code.

Because of the similar division of labour between Go’s compiler and linker, linking is commonly more expensive that compilation. This leads to several problems

  • Linking cannot benefit from incremental compilation, each link pass starts afresh even if only a tiny part of program has changed.
  • Linking speed is at least linear (often worse) with the number of packages being linked into the final executable – larger programs link slower.
  • While multiple commands may be linked in parallel, each individual link is single threaded – as CPU speeds stall, or go backwards, favouring additional cores, linking gets slower in real terms.

It should be noted that while linking is considered slow in terms of the other parts of the Go toolchain, it remains much faster than linking a traditional C or C++ application.

Linking speed has long been recognised as an issue by the Go developers and during the 1.3 development cycle the linker underwent major changes to improve its performance.

What does the Go linker do ?

To understand the change, Russ Cox wrote in his proposal at the beginning of the cycle

The current linker performs two separable tasks.

First, it translates an input stream of pseudo-instructions into executable code and data blocks, along with a list of relocations.

Second, it deletes dead code, merges what’s left into a single image, resolves relocations, and generates a few whole-program data structures such as the runtime symbol table.

In a nutshell, the change has moved the first task of the linker, the pseudo instruction translation, from the linker into the compiler.

What are pseudo instructions ?

Prior to Go 1.3, the output of the compiler, the .a files in your $GOPATH/pkg directory was not directly executable machine code. It was, as Russ describes, a stream of pseudo instructions, which, while not machine independent, it was also not directly executable.

During the linking phase, the linker itself was responsible for turning this pseudo instruction stream into real machine code. Dealing with pseudo instructions during the compilation phase makes the compiler simpler to write.

An example of a pseudo instructions are the unified MOV instruction available to the compiler and assembler

MOV R0, R1          // move the contents of R0 into R1
MOV $80000001, R0   // move the the constant 80000001  into R0
MOV R0, 0           // move the value into R0 into address 0

On a processor like ARM, when translated to machine code, this becomes three separate operations. The first MOV R0, R1 is a simple move from one register to another and the final opcode is MOV.

The second form stores the large constant, 80000001 into R0. ARM processors cannot encode such a large constant directly into the instruction so the linker would store the constant at the end of the function and replace the MOV with a load from an address relative to the program counter into a scratch register (R11 is reserved for the linker) then move the value from R11 to R0.

The final form also needs help from the linker as ARM processors cannot use a constant as an address to store a value. The linker will arrange to load 0 into R11 then store the contents with an instruction like MOV R0, (R11)

The work required for X86 is similar, although the specific restrictions differ.

The results

To evaluate the performance improvements of the change to the linker I’m going to compare building and linking two programs, the venerable godoc and the jujud server binary which depends on almost every line of code in the Juju repo.

In preparation I checked out copies of Go 1.2.1 and Go 1.3beta1 (this data was collected some time ago, but the changes in 1.3beta2 are unrelated to the linker).

godoc

% rm -rf ~/pkg
% time /tmp/go1.2.1/bin/go install code.google.com/p/go.tools/cmd/godoc
real    0m3.239s
user    0m3.307s
sys     0m0.595s

The time to compile and link godoc from scratch on this machine with Go 1.2.1 was 3.2 seconds. Let’s look at the time just to recompile the main package and link godoc

% touch ~/src/code.google.com/p/go.tools/cmd/godoc/play.go
% time /tmp/go1.2.1/bin/go install code.google.com/p/go.tools/cmd/godoc
real    0m1.578s
user    0m1.434s
sys     0m0.146s

With most of the compilation avoided, the total time drops to 1.5 seconds. Let’s look at how the linker change in Go 1.3 affects the results.

% rm -rf ~/pkg
% time /tmp/go1.3beta1/bin/go install code.google.com/p/go.tools/cmd/godoc
real    0m3.193s
user    0m3.441s
sys     0m0.530s

Under Go 1.3beta1 the time to compile and link from scratch is roughly the same as Go 1.2.1. There is perhaps a hint that more work is being done in parallel. Let’s compare the results from an incremental compilation.

% touch ~/src/code.google.com/p/go.tools/cmd/godoc/play.go
% time /tmp/go1.3beta1/bin/go install code.google.com/p/go.tools/cmd/godoc
real    0m0.996s
user    0m0.881s
sys     0m0.118s

Under Go 1.3beta1 the time to recompile godoc‘s main package and link has dropped from 1.5 seconds to just under a second. A saving of half a second, or 30% compared to the performance of Go 1.2.1.

jujud

% rm -rf ~/pkg
% time /tmp/go1.2.1/bin/go install  launchpad.net/juju-core/cmd/jujud
real    0m8.247s
user    0m18.110s
sys     0m3.861s

Time to compile and link jujud from scratch, roughly 220 packages at this time, was 8.2 seconds using Go 1.2.1. Let’s look at the incremental performance.

% touch ~/src/launchpad.net/juju-core/cmd/jujud/main.go
% time /tmp/go1.2.1/bin/go install launchpad.net/juju-core/cmd/jujud
real    0m3.139s
user    0m2.831s
sys     0m0.305s

Which shows the time to recompile the main package and link the executable is 3.2 seconds. You can also see that the process is almost entirely single threaded as the sum of user and sys is equal to the wall clock time, real.

Let’s turn to Go 1.3beta1

% rm -rf ~/pkg
% time /tmp/go1.3beta1/bin/go install launchpad.net/juju-core/cmd/jujud
real    0m8.107s
user    0m20.533s
sys     0m3.574s

The full rebuild times are comparable to the Go 1.2.1 results, possibly a hair faster. The real improvements show themselves in the incremental compilation scenario.

% touch ~/src/launchpad.net/juju-core/cmd/jujud/main.go
% time /tmp/go1.3beta1/bin/go install launchpad.net/juju-core/cmd/jujud
real    0m2.219s
user    0m1.929s
sys     0m0.290s

Under Go 1.3beta1 the time to recompile the main package and link has dropped from 3.2 seconds to 2.2 seconds, a saving of one second, again roughly 30%.

In conclusion

In my tests, the linker improvements coming in Go 1.3 deliver approximately a 30% reduction in link time. Depending on the size of your final executable this could be a small amount, or a significant amount of time.

Overall the linking change has several important benefits:

    1. Because it’s performed in the compile stage, the result is stored in your $GOPATH/pkg directory. Effectively the instruction selection pass is cached, whereas previously it was recomputed for each binary linked even if they shared many common packages.
    2. Because more work is done in the compile stage, it is done in parallel if you have more than one CPU. If you have one CPU the end result is unchanged, the same amount of work is done, just at different phases, although you will benefit from point 1 regardless
    3. Because more work is done in the compilation stage, less work is done in the linker, so the files passed to the linker are smaller and the work it has to do, which is effectively a mark, sweep and compact over all the symbols presented, is less.

In short, the 1.3 linker rocks.

Accidental method value

This is a quick post to discuss an interesting bug that was recently unearthed by go vet.

The following code is a simplified reduction of a larger piece of code. In the original code the if statement was much larger, encompassing several complicated conditions, making the bug hard to spot visually.

package main

import "fmt"
import "io"

type Thing struct {
        Reader_ io.Reader
}

func (t *Thing) Reader() io.Reader { return t.Reader_ }

func main() {
        t := Thing{Reader_: nil}
        if t.Reader != nil {
                fmt.Println("wait a second")
        }
}

Running this code gives the result

% go run thing.go
wait a second

But … what is going on ? Thing.Reader_ is explicitly set to nil (even though this is unnecessary, the zero value of an interface field is nil), so how can the check for nil on the very next line fail?

Let’s look at what go vet thinks.

% go vet thing.go
thing.go:14: comparison of function Reader != nil is always true
exit status 1

The mistake in the original code was the author had intended to write t.Reader(), but perhaps forgot the parenthesis. The uncommon use of the underscore suffix possibly contributed to the bug.

So, a quick fix and a code review later and the bug was closed. But, why was this code valid in the first place ? The answer is, since Go 1.1, the expression t.Reader is no longer a syntax error, instead it evaluates to a Method Value.

Let’s look a little closer

t := Thing{Reader_: nil}
fmt.Printf("Reader_: %T\n", t.Reader_)
fmt.Printf("Reader(): %T\n", t.Reader())
fmt.Printf("Reader: %T\n", t.Reader)

gives the following output

Reader_: <nil>
Reader(): <nil>
Reader: func() io.Reader

The first line says t.Reader_ evaluates to nil, as expected. t.Reader() also evaluates to nil. However, on the third line t.Reader evaluates to a value whose type is func() io.Reader, and as we see from the initial example, because this method value is derived from a method defined at compile time, it cannot be nil, so the comparison is always true.