Category Archives: Go

Don’t just check errors, handle them gracefully

This post is an extract from my presentation at the recent GoCon spring conference in Tokyo, Japan.


Don't just check errors, handle them gracefully

Errors are just values

I’ve spent a lot of time thinking about the best way to handle errors in Go programs. I really wanted there to be a single way to do error handling, something that we could teach all Go programmers by rote, just as we might teach mathematics, or the alphabet.

However, I have concluded that there is no single way to handle errors. Instead, I believe Go’s error handling can be classified into the three core strategies.

Sentinel errors

The first category of error handling is what I call sentinel errors.

if err == ErrSomething { … }

The name descends from the practice in computer programming of using a specific value to signify that no further processing is possible. So to with Go, we use specific values to signify an error.

Examples include values like io.EOF or low level errors like the constants in the syscall package, like syscall.ENOENT.

There are even sentinel errors that signify that an error did not occur, like go/build.NoGoError, and path/filepath.SkipDir from path/filepath.Walk.

Using sentinel values is the least flexible error handling strategy, as the caller must compare the result to predeclared value using the equality operator. This presents a problem when you want to provide more context, as returning a different error would will break the equality check.

Even something as well meaning as using fmt.Errorf to add some context to the error will defeat the caller’s equality test. Instead the caller will be forced to look at the output of the error‘s Error method to see if it matches a specific string.

Never inspect the output of error.Error

As an aside, I believe you should never inspect the output of the error.Error method. The Error method on the error interface exists for humans, not code.

The contents of that string belong in a log file, or displayed on screen. You shouldn’t try to change the behaviour of your program by inspecting it.

I know that sometimes this isn’t possible, and as someone pointed out on twitter, this advice doesn’t apply to writing tests. Never the less, comparing the string form of an error is, in my opinion, a code smell, and you should try to avoid it.

Sentinel errors become part of your public API

If your public function or method returns an error of a particular value then that value must be public, and of course documented. This adds to the surface area of your API.

If your API defines an interface which returns a specific error, all implementations of that interface will be restricted to returning only that error, even if they could provide a more descriptive error.

We see this with io.Reader. Functions like io.Copy require a reader implementation to return exactly io.EOF to signal to the caller no more data, but that isn’t an error.

Sentinel errors create a dependency between two packages

By far the worst problem with sentinel error values is they create a source code dependency between two packages. As an example, to check if an error is equal to io.EOF, your code must import the io package.

This specific example does not sound so bad, because it is quite common, but imagine the coupling that exists when many packages in your project export error values, which other packages in your project must import to check for specific error conditions.

Having worked in a large project that toyed with this pattern, I can tell you that the spectre of bad design–in the form of an import loop–was never far from our minds.

Conclusion: avoid sentinel errors

So, my advice is to avoid using sentinel error values in the code you write. There are a few cases where they are used in the standard library, but this is not a pattern that you should emulate.

If someone asks you to export an error value from your package, you should politely decline and instead suggest an alternative method, such as the ones I will discuss next.

Error types

Error types are the second form of Go error handling I want to discuss.

if err, ok := err.(SomeType); ok { … }

An error type is a type that you create that implements the error interface. In this example, the MyError type tracks the file and line, as well as a message explaining what happened.

type MyError struct {
        Msg string
        File string
        Line int
}

func (e *MyError) Error() string { 
        return fmt.Sprintf("%s:%d: %s”, e.File, e.Line, e.Msg)
}

return &MyError{"Something happened", “server.go", 42}

Because MyError error is a type, callers can use type assertion to extract the extra context from the error.

err := something()
switch err := err.(type) {
case nil:
        // call succeeded, nothing to do
case *MyError:
        fmt.Println(“error occurred on line:”, err.Line)
default:
// unknown error
}

A big improvement of error types over error values is their ability to wrap an underlying error to provide more context.

An excellent example of this is the os.PathError type which annotates the underlying error with the operation it was trying to perform, and the file it was trying to use.

// PathError records an error and the operation
// and file path that caused it.
type PathError struct {
        Op   string
        Path string
        Err  error // the cause
}

func (e *PathError) Error() string

Problems with error types

So the caller can use a type assertion or type switch, error types must be made public.

If your code implements an interface whose contract requires a specific error type, all implementors of that interface need to depend on the package that defines the error type.

This intimate knowledge of a package’s types creates a strong coupling with the caller, making for a brittle API.

Conclusion: avoid error types

While error types are better than sentinel error values, because they can capture more context about what went wrong, error types share many of the problems of error values.

So again my advice is to avoid error types, or at least, avoid making them part of your public API.

Opaque errors

Now we come to the third category of error handling. In my opinion this is the most flexible error handling strategy as it requires the least coupling between your code and caller.

I call this style opaque error handling, because while you know an error occurred, you don’t have the ability to see inside the error. As the caller, all you know about the result of the operation is that it worked, or it didn’t.

This is all there is to opaque error handling–just return the error without assuming anything about its contents. If you adopt this position, then error handling can become significantly more useful as a debugging aid.

import “github.com/quux/bar”

func fn() error {
        x, err := bar.Foo()
        if err != nil {
                return err
        }
        // use x
}

For example, Foo‘s contract makes no guarantees about what it will return in the context of an error. The author of Foo is now free to annotate errors that pass through it with additional context without breaking its contract with the caller.

Assert errors for behaviour, not type

In a small number of cases, this binary approach to error handling is not sufficient.

For example, interactions with the world outside your process, like network activity, require that the caller investigate the nature of the error to decide if it is reasonable to retry the operation.

In this case rather than asserting the error is a specific type or value, we can assert that the error implements a particular behaviour. Consider this example:

type temporary interface {
        Temporary() bool
}
 
// IsTemporary returns true if err is temporary.
func IsTemporary(err error) bool {
        te, ok := err.(temporary)
        return ok && te.Temporary()
}

We can pass any error to IsTemporary to determine if the error could be retried.

If the error does not implement the temporary interface; that is, it does not have a Temporary method, then then error is not temporary.

If the error does implement Temporary, then perhaps the caller can retry the operation if Temporary returns true.

The key here is this logic can be implemented without importing the package that defines the error or indeed knowing anything about err‘s underlying type–we’re simply interested in its behaviour.

Don’t just check errors, handle them gracefully

This brings me to a second Go proverb that I want to talk about; don’t just check errors, handle them gracefully. Can you suggest some problems with the following piece of code?

func AuthenticateRequest(r *Request) error {
        err := authenticate(r.User)
        if err != nil {
                return err
        }
        return nil
}

An obvious suggestion is that the five lines of the function could be replaced with

return authenticate(r.User)

But this is the simple stuff that everyone should be catching in code review. More fundamentally the problem with this code is I cannot tell where the original error came from.

If authenticate returns an error, then AuthenticateRequest will return the error to its caller, who will probably do the same, and so on. At the top of the program the main body of the program will print the error to the screen or a log file, and all that will be printed is: No such file or directory.
No such file or directory
There is no information of file and line where the error was generated. There is no stack trace of the call stack leading up to the error. The author of this code will be forced to a long session of bisecting their code to discover which code path trigged the file not found error.

Donovan and Kernighan’s The Go Programming Language recommends that you add context to the error path using fmt.Errorf

func AuthenticateRequest(r *Request) error {
        err := authenticate(r.User)
        if err != nil {
                return fmt.Errorf("authenticate failed: %v", err)
        }
        return nil
}

But as we saw earlier, this pattern is incompatible with the use of sentinel error values or type assertions, because converting the error value to a string, merging it with another string, then converting it back to an error with fmt.Errorf breaks equality and destroys any context in the original error.

Annotating errors

I’d like to suggest a method to add context to errors, and to do that I’m going to introduce a simple package. The code is online at github.com/pkg/errors. The errors package has two main functions:

// Wrap annotates cause with a message.
func Wrap(cause error, message string) error

The first function is Wrap, which takes an error, and a message and produces a new error.

// Cause unwraps an annotated error.
func Cause(err error) error

The second function is Cause, which takes an error that has possibly been wrapped, and unwraps it to recover the original error.

Using these two functions, we can now annotate any error, and recover the underlying error if we need to inspect it. Consider this example of a function that reads the content of a file into memory.

func ReadFile(path string) ([]byte, error) {
        f, err := os.Open(path)
        if err != nil {
                return nil, errors.Wrap(err, "open failed")
        } 
        defer f.Close()
 
        buf, err := ioutil.ReadAll(f)
        if err != nil {
                return nil, errors.Wrap(err, "read failed")
        }
        return buf, nil
}

We’ll use this function to write a function to read a config file, then call that from main.

func ReadConfig() ([]byte, error) {
        home := os.Getenv("HOME")
        config, err := ReadFile(filepath.Join(home, ".settings.xml"))
        return config, errors.Wrap(err, "could not read config")
}
 
func main() {
        _, err := ReadConfig()
        if err != nil {
                fmt.Println(err)
                os.Exit(1)
        }
}

If the ReadConfig code path fails, because we used errors.Wrap, we get a nicely annotated error in the K&D style.

could not read config: open failed: open /Users/dfc/.settings.xml: no such file or directory

Because errors.Wrap produces a stack of errors, we can inspect that stack for additional debugging information. This is the same example again, but this time we replace fmt.Println with errors.Print

func main() {
        _, err := ReadConfig()
        if err != nil {
                errors.Print(err)
                os.Exit(1)
        }
}

We’ll get something like this:

readfile.go:27: could not read config
readfile.go:14: open failed
open /Users/dfc/.settings.xml: no such file or directory

The first line comes from ReadConfig, the second comes from the os.Open part of ReadFile, and the remainder comes from the os package itself, which does not carry location information.

Now we’ve introduced the concept of wrapping errors to produce a stack, we need to talk about the reverse, unwrapping them. This is the domain of the errors.Cause function.

// IsTemporary returns true if err is temporary.
func IsTemporary(err error) bool {
        te, ok := errors.Cause(err).(temporary)
        return ok && te.Temporary()
}

In operation, whenever you need to check an error matches a specific value or type, you should first recover the original error using the errors.Cause function.

Only handle errors once

Lastly, I want to mention that you should only handle errors once. Handling an error means inspecting the error value, and making a decision.

func Write(w io.Writer, buf []byte) {
        w.Write(buf)
}

If you make less than one decision, you’re ignoring the error. As we see here, the error from w.Write is being discarded.

But making more than one decision in response to a single error is also problematic.

func Write(w io.Writer, buf []byte) error {
        _, err := w.Write(buf)
        if err != nil {
                // annotated error goes to log file
                log.Println("unable to write:", err)
 
                // unannotated error returned to caller
                return err
        }
        return nil
}

In this example if an error occurs during Write, a line will be written to a log file, noting the file and line that the error occurred, and the error is also returned to the caller, who possibly will log it, and return it, all the way back up to the top of the program.

So you get a stack of duplicate lines in your log file, but at the top of the program you get the original error without any context. Java anyone?

func Write(w io.Write, buf []byte) error {
        _, err := w.Write(buf)
        return errors.Wrap(err, "write failed")
}

Using the errors package gives you the ability to add context to error values, in a way that is inspectable by both a human and a machine.

Conclusion

In conclusion, errors are part of your package’s public API, treat them with as much care as you would any other part of your public API.

For maximum flexibility I recommend that you try to treat all errors as opaque. In the situations where you cannot do that, assert errors for behaviour, not type or value.

Minimise the number of sentinel error values in your program and convert errors to opaque errors by wrapping them with errors.Wrap as soon as they occur.

Finally, use errors.Cause to recover the underlying error if you need to inspect it.

Constant errors

This is a thought experiment about sentinel error values in Go.

Sentinel errors are bad, they introduce strong source and run time coupling, but are sometimes necessary. io.EOF is one of these sentinel values. Ideally a sentinel value should behave as a constant, that is it should be immutable and fungible.

The first problem is io.EOF is a public variable–any code that imports the io package could change the value of io.EOF. It turns out that most of the time this isn’t a big deal, but it could be a very confusing problem to debug.

fmt.Println(io.EOF == io.EOF) // true
x := io.EOF
fmt.Println(io.EOF == x)      // true
	
io.EOF = fmt.Errorf("whoops")
fmt.Println(io.EOF == io.EOF) // true
fmt.Println(x == io.EOF)      // false

The second problem is io.EOF behaves like a singleton, not a constant. Even if we follow the exact procedure used by the io package to create our own EOF value, they are not comparable.

err := errors.New("EOF")   // io/io.go line 38
fmt.Println(io.EOF == err) // false

Combine these properties and you have a set of weird behaviours stemming from the fact that sentinel error values in Go, those traditionally created with errors.New or fmt.Errorf, are not constants.

Constant errors

Before I introduce my solution, let’s recap how the error interface works in Go. Any type with an Error() string method fulfils the error interface. This includes primitive types like string, including constant strings.

With that background, consider this error implementation.

type Error string

func (e Error) Error() string { return string(e) }

It looks similar to the errors.errorString implementation that powers errors.New. However unlike errors.errorString this type is a constant expression.

const err = Error("EOF") 
const err2 = errorString{"EOF"} // const initializer errorString literal is not a constant

As constants of the Error type are not variables, they are immutable.

const err = Error("EOF") 
err = Error("not EOF") // error, cannot assign to err

Additionally, two constant strings are always equal if their contents are equal, which means two Error values with the same contents are equal.

const err = Error("EOF") 
fmt.Println(err == Error("EOF")) // true

Said another way, equal Error values are the same, in the way that the constant 1 is the same as every other constant 1.

const eof = Error("eof")

type Reader struct{}

func (r *Reader) Read([]byte) (int, error) {
        return 0, eof
}

func main() {
        var r Reader
        _, err := r.Read([]byte{})
        fmt.Println(err == eof) // true
}

Could we change the definition of io.EOF to be a constant? It turns out that this compiles just fine and passes all the tests, but it’s probably a stretch for the Go 1 contract.

However this does not prevent you from using this idiom in your own code. Although, you really shouldn’t be using sentinel errors anyway.

Go 1.7 toolchain improvements

This is a progress report on the Go toolchain improvements during the 1.7 development cycle. All measurements were taken using a Thinkpad x220, Core i5-2520M, running Ubuntu 14.04 linux.

Faster compilation

Since Go 1.5, when the compiler itself was translated from C to Go, compile times are slower than they used to be. Everyone knows it, nobody is happy about it, and we’re working on fixing it.

A huge amount of effort in the 1.7 cycle has gone into reducing the amount of memory and the wall time the compiler uses for various benchmark jobs. The results so far are:

Compile time for full build relative to Go 1.4.3

Compile time for full build relative to Go 1.4.3

Previously I reported the current 1.7 compiler was 2x slower than Go 1.4.3 for the Jujud test. After re-benchmarking everything for this post, the slowdown is closer to 2.2x. Jujud is the largest of the three benchmarks–512 packages, vs 304 and 102 packages respectively–and shows the largest slowdown.

The cmd/go result is a little misleading as the code being compiled changes with every release, vs the fixed codebases of the other benchmarks.

Note: The benchmark scripts for jujud, kube-controller-manager, and gogs are online. Please try them yourself and report your findings.

Improved linker performance

A significant part of the build time improvements observed above come from improvements to the linker. Relative to Go 1.6, the linker is now roughly 66% faster.

Link time relative to Go 1.4.3

Link time relative to Go 1.4.3

Relative to Go 1.4.3, linking is 10% faster for any non trivial binary, and up to 30% faster for large binaries like jujud. These figures are for ELF targets only, Mach-o and PE targets have not improved as much.

This isn’t just useful for building final binaries. A faster linker improves the edit/compile/test cycle as each test is itself a program that must be linked and run. Anecdotally the linker now uses a third less memory, which is valuable when linking large binaries.

Smaller binaries

With code generation and linker improvements, binaries produced by the tip compiler are substantially smaller than Go 1.6. This work has been spearheaded by David Crawshaw.

Binary sizes

Binary size (bytes)

At this point, with the exception of its own cmd/go tool, Go 1.7 produces smaller binaries than Go 1.4.3.

Code generation improvements

The big feature for the Go 1.7 cycle is the new SSA backend for 64bit Intel.

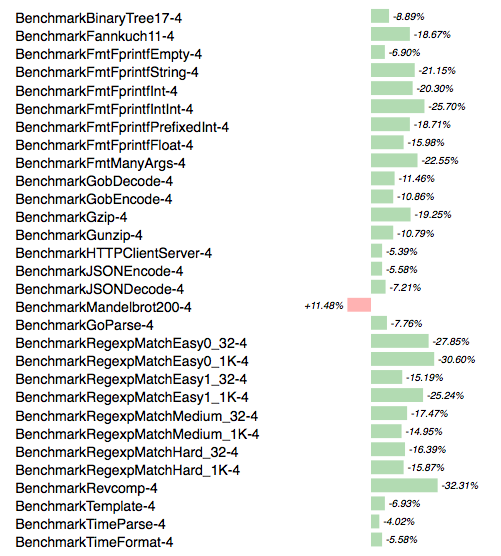
While not the focus of this post, it would be remiss not to include some information about performance improvements in compiled code (not just the compiler’s code). Stressing of course that these are preliminary figures as there is still four months to go before the new backend becomes the default for amd64.

Go 1 benchmarks, Go 1.6 vs 683448a

Go 1 benchmarks, Go 1.6 vs 683448a

These numbers match the figures reported by Keith Randall a few weeks ago, and are in line with his thesis in the SSA design doc.

I think it would be fairly easy to make the generated programs 20% smaller and 10% faster. — khr

These improvements are not just the work of the SSA backend. The standard library and garbage collector continue to see improvements, including a 20% improvement to the fmt package by Martin Möhrmann. These benefits flow to all the platforms that Go supports.

The sole regression above is caused by a current limitation in the register optimiser which manages to registerise one less variable in the Mandelbrot inner loop.

Looking ahead

According to the release schedule, approximately one month remains before the 1.7 change window closes and the dev cycle enters the bug fix phase. There is still lots of work to do, but the improvements so far will easily make Go 1.7 the best Go release to date.

Go project contributors by the numbers

In December 2014 the Go project moved from Google Code to GitHub. Along with the move to GitHub, the Go project moved from Mercurial to Git, which necessitated a move away from Rietveld to Gerrit for code review.

A healthy open source project lives and dies by its contributors. People come and people go as time, circumstance, their jobs, and their interests change. I wanted to investigate if these moves were a net positive for the project.

Go project contributors

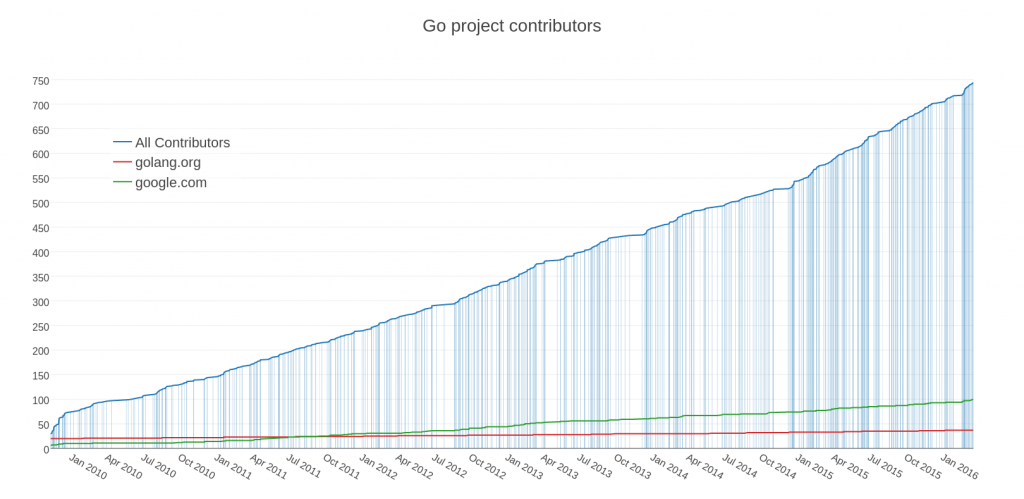
As of writing 744 people have contributed to the Go project. This number is slightly lower than OpenHub‘s count, which also includes the golang.org/x sub-repositories that this analysis ignores. The number is slightly higher than GitHub‘s count for reasons which are unclear.

Go project contributors (click to enlarge)

Go project contributors (click to enlarge)

This graph shows contributors over time. As a new contributor lands their first commit, a line representing the current count of contributors is placed on the graph. The graph also records the number of contributors whose email addresses end in golang.org or google.com as a proxy for the Go team and Google employees respectively.

Did the move to Git, Gerrit, and GitHub increase the number of contributors, and thereby contributions? Almost certainly. The graph shows a clear up-tick in the number of new contributors to the project from January 2015 onwards. However with so many factors in play it is not possible to identify a single cause.

It should also be noted that even prior to the move, the project has always attracted a healthy stream of new contributors.

Runtime contributors

Runtime contributors (click to enlarge)

Runtime contributors (click to enlarge)

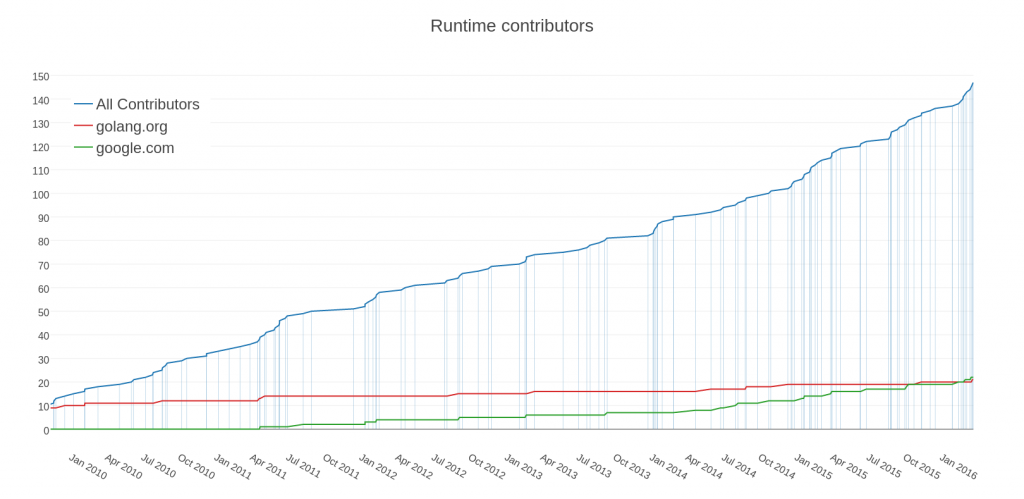
From June 2014 to December 2014, the Go runtime was rewritten (with the help of some automated tools) from C to Go. This graph records the number of contributors to the parts of the standard library considered the runtime. This has changed over time as paths have been renamed, but is currently what we think of as the tree rooted at $GOROOT/src/runtime.

Did the rewrite of the runtime from a dialect of C that was compiled with the project’s own C compiler to Go increase the number of individual contributors willing to work on the runtime? Unfortunately not, although the number of Googlers contributing to the the runtime did increase slightly.  An increase in individual runtime contributions did not occur till the following January once the move to GitHub was complete.

Compiler contributors

Compiler contributors (click to enlarge)

Compiler contributors (click to enlarge)

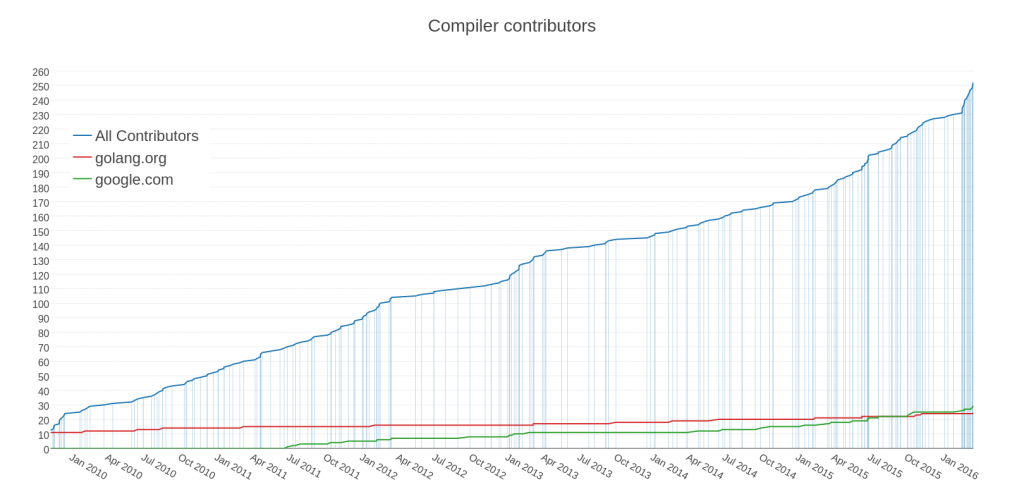
After the move to GitHub, the Go compiler was translated from C to Go for the Go 1.5 release. This process was completed by May 2015. Did this have an impact on the number of new contributors specifically targeting the compiler? Possibly, there was a short lived spurt of new contributions around July 2015. The reason for this could be attributed to the strong message from the Go team that the 1.5 release was focusing on the runtime, specifically the garbage collector, and that the current compiler was to be replaced with the SSA back end being developed for the 1.6 time frame (since delayed til 1.7).

This latter point is supported by the clear spike in contributors after February 2016, when the 1.7 tree opened for development with the SSA back end attracting a number of talented new contributors.

An open source project

At the moment there is no question that the largest contributors by total commits to Go are the Go team themselves. This stands to reason as they are sponsored by Google itself to develop the language. However, out of the current top 16 contributors to the project, the number 7th, 9th, 11th, 14th, and 16th contributors are neither members of the Go team or employed by Google.

The charge is commonly levelled at Google that Go is not an open source project. This analysis shows that claim to be false. The number of contributors from the Go team, or Google, continues to be a dwindling fraction of the total number of contributors to the project.

Should methods be declared on T or *T

This post is a continuation of a suggestion I made on twitter a few days ago.

In Go, for any type T, there exists a type *T which is the result of an expression that takes the address of a variable of type T1. For example:

type T struct { a int; b bool }
var t T    // t's type is T
var p = &t // p's type is *T

These two types, T and *T are distinct, but *T is not substitutable for T2.

You can declare a method on any type that you own; that is, a type that you declare in your package3. Thus it follows that you can declare methods on both the type you declare, T, and its corresponding derived pointer type, *T. Another way to talk about this is to say methods on a type are declared to take a copy of their receiver’s value, or a pointer to their receiver’s value 4. So the question becomes, which is the most appropriate form to use?

Obviously if your method mutates its receiver, it should be declared on *T. However, if the method does not mutate its receiver, is it safe to declare it on T instead5?

It turns out that the cases where it is safe to do so are very limited. For example, it is well known that you should not copy a sync.Mutex value as that breaks the invariants of the mutex. As mutexes control access to other things, they are frequently wrapped up in a struct with the value they control:

package counter

type Val struct {
        mu  sync.Mutex
        val int
}

func (v *Val) Get() int {
        v.mu.Lock()
        defer v.mu.Unlock()
        return v.val
}

func (v *Val) Add(n int) {
        v.mu.Lock()
        defer v.mu.Unlock()
        v.val += n
}

Most Go programmers know that it is a mistake to forget to declare the Get or Add methods on the pointer receiver *Val. However any type that embeds a Val to utilise its zero value, must also only declare methods on its pointer receiver otherwise it may inadvertently copy the contents of its embedded type’s values.

type Stats struct {
        a, b, c counter.Val
}

func (s Stats) Sum() int {
        return s.a.Get() + s.b.Get() + s.c.Get() // whoops
}

A similar pitfall can occur with types that maintain slices of values, and of course there is the possibility for an unintended data race.

In short, I think that you should prefer declaring methods on *T unless you have a strong reason to do otherwise.


  1. We say T but that is just a place holder for a type that you declare.
  2. This rule is recursive, taking the address of a variable of type *T returns a result of type **T.
  3. This is why nobody can declare methods on primitive types like int.
  4. Methods in Go are just syntactic sugar for a function which passes the receiver as the first formal parameter.
  5. If the method does not mutate its receiver, does it need to be a method?

Investigate your package dependencies with prdeps and Unix

At $DAYJOB I work on a very large Go application; hundreds and hundreds of packages. Recently I’ve been trying to untangle some code that has inadvertently grown huge trunks of dependencies. I suspect this is what is causing the time taken to link our tests to become the subject of ridicule.

I’ve tried previously to visualise the dependency graph of a package, and found the results unsatisfying. This time around I decided to write something simpler, and was pleased with the results. I present prdeps.

In traditional unix style, prdeps does very little, and expects to be part of a larger text processing pipeline.

% prdeps github.com/pkg/sftp
github.com/pkg/sftp:
  github.com/kr/fs:
  golang.org/x/crypto/ssh:
    golang.org/x/crypto/curve25519:

Because Go packages are not a DAG, but a graph not a tree, but a directed graph, the output of running prdeps on any non trivial package is going to be verbose–be prepared for this.

prdeps, like go list takes a -f flag to modify its output. In this example we alter the output format from the usual indented version (which is presented to the template as .Indent) and disable suppression of the stdlib with the -s flag.

% prdeps -s -f {{.ImportPath}} github.com/pkg/sftp | head -n5
github.com/pkg/sftp
bytes
errors
io
errors

Note that errors appears twice in the first five lines of output. errors actually appears 763 times in the output because almost every package either imports it directly and imports a package which also imports errors.

% prdeps -s -f {{.ImportPath}} github.com/pkg/sftp | grep -c errors
763

Another prdeps feature is to print the import graph from the perspective of a test (-t is for internal tests, -T is for external):

% prdeps -T github.com/pkg/sftp
github.com/pkg/sftp:
  github.com/pkg/sftp:
    github.com/kr/fs:
    golang.org/x/crypto/ssh:
      golang.org/x/crypto/curve25519:
  golang.org/x/crypto/ssh:
    golang.org/x/crypto/curve25519:

Compare this to the previous non test output above. This feature was why I built prdeps as I wanted to track down reason the linker was taking so long to link the tests for some of our packages.

prdeps took about 30 minutes to write, and another hour to address the performance issues from several million lines of output that are produced by a non trivial invocation. I’m sure the same result could be done with the right amount of go list, but the pleasure of being able to write exactly the tool I wanted for the job at hand was reason enough for me.

Unhelpful abstractions

Sandi Metz’s post on abstraction struck a chord with me recently. I was working with a piece of code which looked like this (in pseudo code):

func Start() {
        const filename = "..."
        createOuputFile(filename)
        go run(filename)
}

It turned out that createOutputFile was written in an obscure way which first caused me to look at it more closely. Why the code expected the file to exist before starting wasn’t immediately clear. It may have been because some other goroutine was expecting the file to exist on disk, even if nothing had been written yet (slight race smell), or more likely the necessary information was not available for the job itself to create the file with the correct permissions. This calls for a refactoring!

There is a well known UNIX utility that provides these semantics, touch(1). So, I reasoned, createOutputFile is really touch plus the ability to set file permissions, which the former was hard coded to do implicitly. This was a job for abstraction!

How would you write the signature for TouchFile? Here is what I came up with:

// TouchFile ensures path exists, or creates it using
// the supplied file mode.
func TouchFile(path string, mode os.FileMode) error

This looked pretty reasonable, and was a nice generalisation over the previous function. TouchFile makes setting the file mode on creation, the primary reason why this code existed in the first place, explicit.

However, this is precisely the train of thought that Metz warned of in her post. By generalising this function I had made its API worse.

Specifically, now every caller to this function has to pass in a mode value, even if the file exists, even if they don’t really care and are happy with a default file mode. Worse still, mode is only applied if the file is not already present. Not only had I made this function harder to use in its default use case, I’d added a footgun to the API that someone might call this function expecting it to update the mode of an existing file.

The second clue that I was heading in the wrong direction was the implementation of TouchFile itself:

func TouchFile(path string, mode os.FileMode) error {
        f, err := os.OpenFile(path, os.O_WRONLY|os.O_CREATE, mode)
        if err != nil {
                return err
        }
        return f.Close()
}

TouchFile just calls os.OpenFile passing in the right flags to get the create-if-missing semantics it wants. You still have to pass in the mode, because os.OpenFile requires a mode, so the utility of TouchFile as a wrapper is undermined by the cognitive overhead of having to remember its quirks.

Coming to my senses, I reverted my change and replaced createOutputFile with a direct call to os.OpenFile.

Whereas someone reading this code and seeing a call to TouchFile may think that the goal is to ensure the file exists, will miss the subtle point that purpose of Start was to ensure that the file exists with the right permission. By making a direct call to the os package in body of the function it becomes explicit to the next reader, who already knows the os package, that the file is being created explicitly is to set the mode.

I realised that I hadn’t made things simpler by adding this abstraction, instead I’d made them more opaque. Sometimes it’s better to be explicit than abstract.

cgo is not Go

To steal a quote from JWZ,

Some people, when confronted with a problem, think “I know, I’ll use cgo.”
Now they have two problems.

Recently the use of cgo came up on the Gophers’ slack channel and I voiced my concerns that using cgo, especially on a project that is intended to showcase Go inside an organisation was a bad idea. I’ve said this a number of times, and people are probably sick of hearing my spiel, so I figured that I’d write it down and be done with it.

cgo is an amazing technology which allows Go programs to interoperate with C libraries. It’s a tremendously useful feature without which Go would not be in the position it is today. cgo is key to ability to run Go programs on Android and iOS.

However, and to be clear these are my opinions, I am not speaking for anyone else, I think cgo is overused in Go projects. I believe that when faced with reimplementing a large piece of C code in Go, programmers choose instead to use cgo to wrap the library, believing that it is a more tractable problem. I believe this is a false economy.

Obviously, there are some cases where cgo is unavoidable, most notably where you have to interoperate with a graphics driver or windowing system that is only available as a binary blob. But those cases where cgo’s use justifies its trade-offs are fewer and further between than many are prepared to admit.

Here is an incomplete list of trade-offs you make, possibly without realising them, when you base your Go project on a cgo library.

Slower build times

When you import "C" in your Go package, go build has to do a lot more work to build your code. Building your package is no longer simply passing a list of all the .go files in scope to a single invocation of go tool compile, instead:

  • The cgo tool needs to be invoked to generate the C to Go and Go to C thunks and stubs.
  • Your system C compiler has to be invoked for every C file in the package.
  • The individual compilation units are combined together into a single .o file.
  • The resulting .o file take a trip through the system linker for fix-ups against shared objects they reference.

All this work happens every time you compile or test your package, which is constantly, if you’re actively working in that package. The Go tool parallelises some of this work where possible, but your packages’ compile time just grew to include a full rebuild of all that C code.

It’s possible to work around this by pushing the cgo shims out into their own package, avoiding the compile time hit, but now you’ve had to restructure your application to work around a problem that you didn’t have before you started to use cgo.

Oh, and you have to debug C compilation failures on the various platforms your package supports.

Complicated builds

One of the goals of Go was to produce a language who’s build process was self describing; the source of your program contains enough information for a tool to build the project. This is not to say that using a Makefile to automate your build workflow is bad, but before cgo was introduced into a project, you may not have needed anything but the go tool to build and test. Afterwards, to set all the environment variables, keep track of shared objects and header files that may be installed in weird places, now you do.

Keep in mind that Go supports platforms that don’t ship with make out of the box, so you’ll have to dedicate some time to coming up with a solution for your Windows users.

Oh, and now your users have to have a C compiler installed, not just a Go compiler. They also have to install the C libraries your project depends on, so you’ll be taking on that support cost as well.

Cross compilation goes out the window

Go’s support for cross compilation is best in class. As of Go 1.5 you can cross compile from any supported platform to any other platform with the official installer available on the Go project website.

By default cgo is disabled when cross compiling. Normally this isn’t a problem if your project is pure Go. When you mix in dependencies on C libraries, you either have to give up the option to cross compile your product, or you have to invest time in finding and maintaining cross compilation C toolchains for all your targets.

Maybe if you work on a product that only communicates with clients over TCP sockets and you intend to run it in a SaaS model it’s reasonable to say that you don’t care about cross compilation. However, if you’re making a product which others will use, possibly integrated into their products, maybe it’s a monitoring solution, maybe it’s a client for your SaaS service, then you’ve locked them out of being able to easily cross compile.

The number of platforms that Go supports continues to grow. Go 1.5 added support for 64 bit ARM and PowerPC. Go 1.6 adds support for 64 bit MIPS, and IBM’s s390 architecture is touted for Go 1.7. RISC-V is in the pipeline. If your product relies on a C library, not only do you have the all problems of cross compilation described above, you also have to make sure the C code you depend on works reliably on the new platforms Go is supporting — and you have to do that with the limited debuggability a C/Go hybrid affords you. Which brings me to my next point.

You lose access to all your tools

Go has great tools; we have the race detector, pprof for profiling code, coverage, fuzz testing, and source code analysis tools. None of those work across the cgo blood/brain barrier.

Conversely excellent tools like valgrind don’t understand Go’s calling conventions or stack layout.  On that point, Ian Lance Taylor’s work to integrate clang’s memory sanitiser to debug dangling pointers on the C side will be of benefit for cgo users in Go 1.6.

Combing Go code and C code results in the intersection of both worlds, not the union; the memory safety of C, and the debuggability of a Go program.

Performance will always be an issue

C code and Go code live in two different universes, cgo traverses the boundary between them. This transition is not free and depending on where it exists in your code, the cost could be inconsequential, or substantial.

C doesn’t know anything about Go’s calling convention or growable stacks, so a call down to C code must record all the details of the goroutine stack, switch to the C stack, and run C code which has no knowledge of how it was invoked, or the larger Go runtime in charge of the program.

To be fair, Go doesn’t know anything about C’s world either. This is why the rules for passing data between the two have become more onerous over time as the compiler becomes better at spotting stack data that is no longer considered live, and the garbage collector becomes better at doing the same for the heap.

If there is a fault while in the C universe, the Go code has to recover enough state to at least print a stack trace and exit the program cleanly, rather than barfing up a core file.

Managing this transition across call stacks, especially where signals, threads and callbacks are involved is non trivial, and again Ian Lance Taylor has done a huge amount of work in Go 1.6 to improve the interoperability of signal handling with C.

The take away is that the transition between the C and Go world is non trivial, and it will never be free from overhead.

C calls the shots, not your code

It doesn’t matter which language you’re writing bindings or wrapping C code with; Python, Java with JNI, some language using libFFI, or Go via cgo; it’s C’s world, you’re just living in it.

Go code and C code have to agree on how resources like address space, signal handlers, and thread TLS slots are to be shared — and when I say agree, I actually mean Go has to work around the C code’s assumption. C code that can assume it always runs on one thread, or blithely be unprepared to work in a multi threaded environment at all.

You’re not writing a Go program that uses some logic from a C library, instead you’re writing a Go program that has to coexist with a belligerent piece of C code that is hard to replace, has the upper hand negotiations, and doesn’t care about your problems.

Deployment gets more complicated

Any presentation on Go to a general audience will contain at least one slide with these words:

Single, static binary

This is Go’s ace in the hole that has lead it to become a poster child of the movement away from virtual machines and managed runtimes. Using cgo, you give that up.

Depending on your environment, it’s probably possible to build your Go project into a deb or rpm, and assuming your other dependencies are also packaged, add them as an install dependency and push the problem off the operating system’s package manager. But that’s several significant changes to a build and deploy process that was previously as straight forward as go build && scp.

It is possible to compile a Go program entirely statically, but it is by no means simple and shows that the ramifications of including cgo in your project will ripple through your entire build and deploy life cycle.

Choose wisely

To be clear, I am not saying that you should not use cgo. But before you make that Faustian bargain, please consider carefully the qualities of Go that you’ll be giving up in return.

Are Go maps sensitive to data races ?

Panic messages from unexpected program crashes are often reported on the Go issue tracker. An overwhelming number of these panics are caused by data races, and an overwhelming number of those reports centre around Go’s built in map type.

unexpected fault address 0x0
fatal error: fault
[signal 0x7 code=0x80 addr=0x0 pc=0x40873b]

goroutine 97699 [running]:
runtime.throw(0x17f5cc0, 0x5)
    /usr/local/go/src/runtime/panic.go:527
runtime.sigpanic()
    /usr/local/go/src/runtime/sigpanic_unix.go:21
runtime.mapassign1(0x12c6fe0, 0xc88283b998, 0xc8c9b63c68, 0xc8c9b63cd8)
    /usr/local/go/src/runtime/hashmap.go:446

Why is this so ? Why is a map commonly involved with a crash ? Is Go’s map implementation inherently fragile ?

To cut to the chase: no, there is nothing wrong with Go’s map implementation. But if there is nothing wrong with the implementation, why do maps and panic reports commonly find themselves in close proximity ?

There are three reasons that I can think of.

Maps are often used for shared state

Maps are fabulously useful data structures and this makes them perfect for tasks such as a shared cache of precomputed data or a lookup table of outstanding requests. The common theme here is the map is being used to store data shared across multiple goroutines.

Maps are more complex structures

Compared to the other built in data types like channels and slices, Go maps are more complex — they aren’t just views onto a backing array of elements. Go maps contain significant internal state, and map iterators (for k, v := range m) contain even more.

Go maps are not goroutine safe, you must use a sync.Mutex, sync.RWMutex or other memory barrier primitive to ensure reads and writes are properly synchronised. Getting your locking wrong will corrupt the internal structure of the map.

Maps move things

Of all of Go’s built in data structures, maps are the only ones that move data internally. When you insert or delete entries, the map may need to rebalance itself to retain its O(1) guarantee. This is why map values are not addressable.

Without proper synchronisation different CPUs will have different representations of the map’s internal structure in their caches. Although the language lawyers will tell you that a program with a data race exhibits undefined behaviour, it’s easy to see how having a stale copy of a map’s internal structure can lead to following a stale pointer to oblivion.

Please use the race detector

Go ships with a data race detector that works on Windows, Linux, FreeBSD and OSX. The race detector will spot this issue, and many more.

Please use it when testing your code.

A whirlwind tour of Go’s runtime environment variables

Introduction

The Go runtime, in addition to providing the usual services of garbage collection, goroutine scheduling, timers, network polling and so forth, contains facilities to enable extra debugging output and even alter the behaviour of the runtime itself.

These facilities are controlled by environment variables passed to the Go program. This post describes the function of the major environment variables supported by the runtime.

GOGC

GOGC is one of the oldest environment variable supported by the Go runtime. It’s possibly older than GOROOT, but nowhere near as well known.

GOGC controls the aggressiveness of the garbage collector. By default this value is assumed to be 100, which means garbage collection will not be triggered until the heap has grown by 100% since the previous collection. Effectively GOGC=100 (the default) means the garbage collector will run each time the live heap doubles.

Setting this value higher, say GOGC=200, will delay the start of a garbage collection cycle until the live heap has grown to 200% of the previous size. Setting the value lower, say GOGC=20 will cause the garbage collector to be triggered more often as less new data can be allocated on the heap before triggering a collection.

Setting GOGC=off will disable garbage collection entirely.

With the introduction of the low latency collector in Go 1.5, phrases like “trigger a garbage collection cycle” become more fluid, but the underlying message that values of GOGC greater than 100 mean the garbage collector will run less often, and for values of GOGC less than 100, more often, remains the same.

GOTRACEBACK

GOTRACEBACK controls the level of detail when a panic hits the top of your program. In Go 1.5 GOTRACEBACK has four valid values.

  • GOTRACEBACK=0 will suppress all tracebacks, you only get the panic message.
  • GOTRACEBACK=1 is the default behaviour, stack traces for all goroutines are shown, but stack frames related to the runtime are suppressed.
  • GOTRACEBACK=2 is the same as the previous value, but frames related to the runtime are also shown, this will reveal goroutines started by the runtime itself.
  • GOTRACEBACK=crash is the same as the previous value, but rather than calling os.Exit, the runtime will cause the process to segfault, triggering a core dump if permitted by the operating system.

The effect of GOTRACEBACK can be seen with a simple program.

package main

func main() {
        panic("kerboom")
}

Compiling and running this program with GOTRACEBACK=0 shows the suppression of all goroutine stack traces.

% env GOTRACEBACK=0 ./crash 
panic: kerboom
% echo $?
2

Experimentation with the other possible values of GOTRACEBACK is left as an exercise to the reader.

Changes to GOTRACEBACK coming in Go 1.6

For Go 1.6 the interpretation of GOTRACEBACK is changing. The new values of GOTRACEBACK will be:

  • GOTRACEBACK=none will suppress all tracebacks, you only get the panic message.
  • GOTRACEBACK=single is the new default behaviour that prints only the goroutine believed to have caused the panic.
  • GOTRACEBACK=all causes stack traces for all goroutines to be shown, but stack frames related to the runtime are suppressed.
  • GOTRACEBACK=system is the same as the previous value, but frames related to the runtime are also shown, this will reveal goroutines started by the runtime itself.
  • GOTRACEBACK=crash is unchanged from Go 1.5.

For compatibility with Go 1.5, a value of 0 maps to none, 1 maps to all, and 2 maps to system.

The major take away from this change is, by default in Go 1.6, panic messages will only print the stack trace for the faulting goroutine. This change is detailed in issue 12366 and CL 16512.

GOMAXPROCS

GOMAXPROCS is the well known (and cargo culted via its runtime.GOMAXPROCS counterpart), value that controls the number of operating system threads allocated to goroutines in your program.

As of Go 1.5, the default value of GOMAXPROCS is the number of CPUs (whatever your operating system considers to be a CPU) visible to the program at startup.

note: the number of operating system threads in use by a Go program includes threads servicing cgo calls, thread blocked on operating system calls, and may be larger than the value of GOMAXPROCS.

GODEBUG

Saving the best for last is GODEBUG. The contents of GODEBUG are interpreted as a list of name=value pairs separated by commas, where each name is a runtime debugging facility. Here is an example invoking godoc with garbage collection and schedule tracing enabled:

% env GODEBUG=gctrace=1,schedtrace=1000 godoc -http=:8080

The remainder of this post will discuss the GODEBUG debugging facilities that I find useful to diagnosing Go programs.

gctrace

Of all the GODEBUG facilities, gctrace is the one I find most useful. Here is the output of the first few milliseconds of a godoc -http server with gctrace debugging enabled:

% env GODEBUG=gctrace=1 godoc -http=:8080 -index
gc #1 @0.042s 4%: 0.051+1.1+0.026+16+0.43 ms clock, 0.10+1.1+0+2.0/6.7/0+0.86 ms cpu, 4->32->10 MB, 4 MB goal, 4 P
gc #2 @0.062s 5%: 0.044+1.0+0.017+2.3+0.23 ms clock, 0.044+1.0+0+0.46/2.0/0+0.23 ms cpu, 4->12->3 MB, 8 MB goal, 4 P
gc #3 @0.067s 6%: 0.041+1.1+0.078+4.0+0.31 ms clock, 0.082+1.1+0+0/2.8/0+0.62 ms cpu, 4->6->4 MB, 8 MB goal, 4 P
gc #4 @0.073s 7%: 0.044+1.3+0.018+3.1+0.27 ms clock, 0.089+1.3+0+0/2.9/0+0.54 ms cpu, 4->7->4 MB, 6 MB goal, 4 P

The format of this output changes with every version of Go, but you will always find commonalities like the amount of time of the various gc phases; 0.051+1.1+0.026+16+0.43 ms clock, and the various heap sizes during garbage collection cycle; 4->6->4 MB. This trace also includes the timestamp the gc cycle completed, relative to the start time of the program, however older versions of Go omit this information.

The individual output lines may be useful for analysis, but I find it more useful to view them in aggregate. For example, if you enable gc tracing and the output is continuous, it’s a clear sign that the program is allocation bound. Likewise if the reported size of the heap continues to grow over time, that is a clear sign of a memory leak where references that are expected to be freed are being retained in some global structure.

The overhead of enabling gctrace is effectively zero for production deployments as these statistics are always being collected, but are normally suppressed. I recommend that you enable it at least for some representative sample of your application’s production deployment.

note:setting gctrace to values larger than 1 causes each garbage collection cycle to be run twice. This exercises some aspects of finalisation that require two garbage collection cycles to complete. You should not use this as a mechanism to alter finalisation performance in your programs because you should not write programs whose correctness depends on finalisation.

The heap scavenger

By far the most useful piece of output enabled by gctrace=1 is the output of the heap scavenger.

scvg143: inuse: 8, idle: 104, sys: 113, released: 104, consumed: 8 (MB)

The scavenger’s job is to periodically sweep the heap looking for unused operating system pages. The scavenger then releases them by notifying the operating system that these memory pages from the heap that are not in use. There is no facility to force the operating system to take back the page and many operating systems choose to ignore this advice, or at least defer taking any action until the a time when the machine is starved for free memory.

The output from the scavenger is the best way I know of to tell how much virtual address space is in use by your Go program. It is expected that these values will vary significantly from what tools like free(1) and top(1) report. You should trust the values reported by the scavenger.

schedtrace

Because the Go runtime manages the allocation of a large set of goroutines onto a smaller set of operating system threads, observing your program externally may not give sufficient detail to understand its performance. You may need to investigate the operation of the runtime scheduler directly.  This output is controlled with the schedtrace value:

% env GODEBUG=schedtrace=1000 godoc -http=:8080 -index
SCHED 0ms: gomaxprocs=4 idleprocs=2 threads=4 spinningthreads=1 idlethreads=0 runqueue=0 [0 0 0 0]
SCHED 1001ms: gomaxprocs=4 idleprocs=0 threads=8 spinningthreads=0 idlethreads=2 runqueue=0 [189 197 231 142]
SCHED 2004ms: gomaxprocs=4 idleprocs=0 threads=9 spinningthreads=0 idlethreads=1 runqueue=0 [54 45 38 86]
SCHED 3011ms: gomaxprocs=4 idleprocs=0 threads=9 spinningthreads=0 idlethreads=2 runqueue=2 [85 0 67 111]
SCHED 4018ms: gomaxprocs=4 idleprocs=3 threads=9 spinningthreads=0 idlethreads=4 runqueue=0 [0 0 0 0]

A detailed discussion of the schedtrace output is available in Dmitry Vyukov’s excellent blog post from the Intel DeveloperZone.

Append scheddetail=1 will cause the runtime to output the state of each individual goroutine in addition to the summary, producing very verbose output.

% env GODEBUG=scheddetail=1,schedtrace=1000 godoc -http=:8080 -index
SCHED 0ms: gomaxprocs=4 idleprocs=3 threads=3 spinningthreads=0 idlethreads=0 runqueue=0 gcwaiting=0 nmidlelocked=0 stopwait=0 sysmonwait=0
  P0: status=1 schedtick=0 syscalltick=0 m=0 runqsize=0 gfreecnt=0
  P1: status=0 schedtick=0 syscalltick=0 m=-1 runqsize=0 gfreecnt=0
  P2: status=0 schedtick=0 syscalltick=0 m=-1 runqsize=0 gfreecnt=0
  P3: status=0 schedtick=0 syscalltick=0 m=-1 runqsize=0 gfreecnt=0
  M2: p=-1 curg=-1 mallocing=0 throwing=0 preemptoff= locks=1 dying=0 helpgc=0 spinning=false blocked=false lockedg=-1
  M1: p=-1 curg=17 mallocing=0 throwing=0 preemptoff= locks=0 dying=0 helpgc=0 spinning=false blocked=false lockedg=17
  M0: p=0 curg=1 mallocing=0 throwing=0 preemptoff= locks=2 dying=0 helpgc=0 spinning=false blocked=false lockedg=1
  G1: status=2(stack growth) m=0 lockedm=0
  G17: status=3() m=1 lockedm=1
  G2: status=1() m=-1 lockedm=-1

This output may be useful for debugging leaking goroutines, but other facilities like net/http/pprof are likely to be more useful.

Further reading

All the environment variables available for your version of Go are detailed in the godoc for the runtime package.